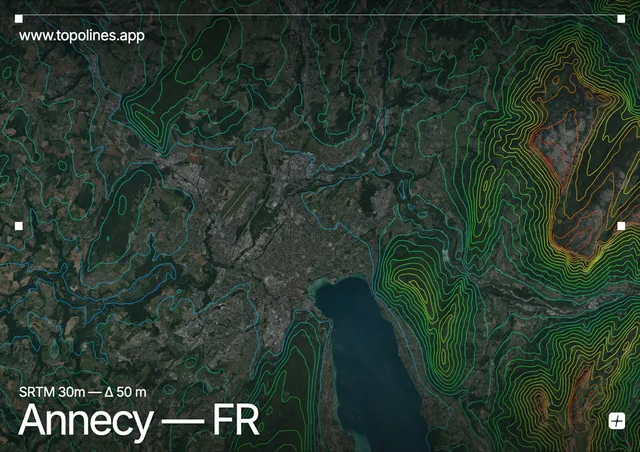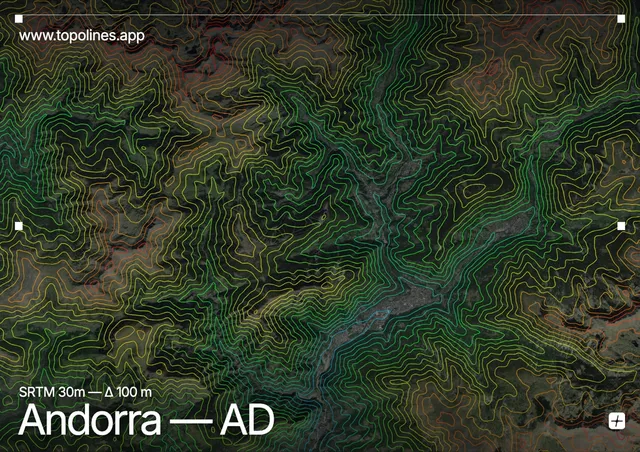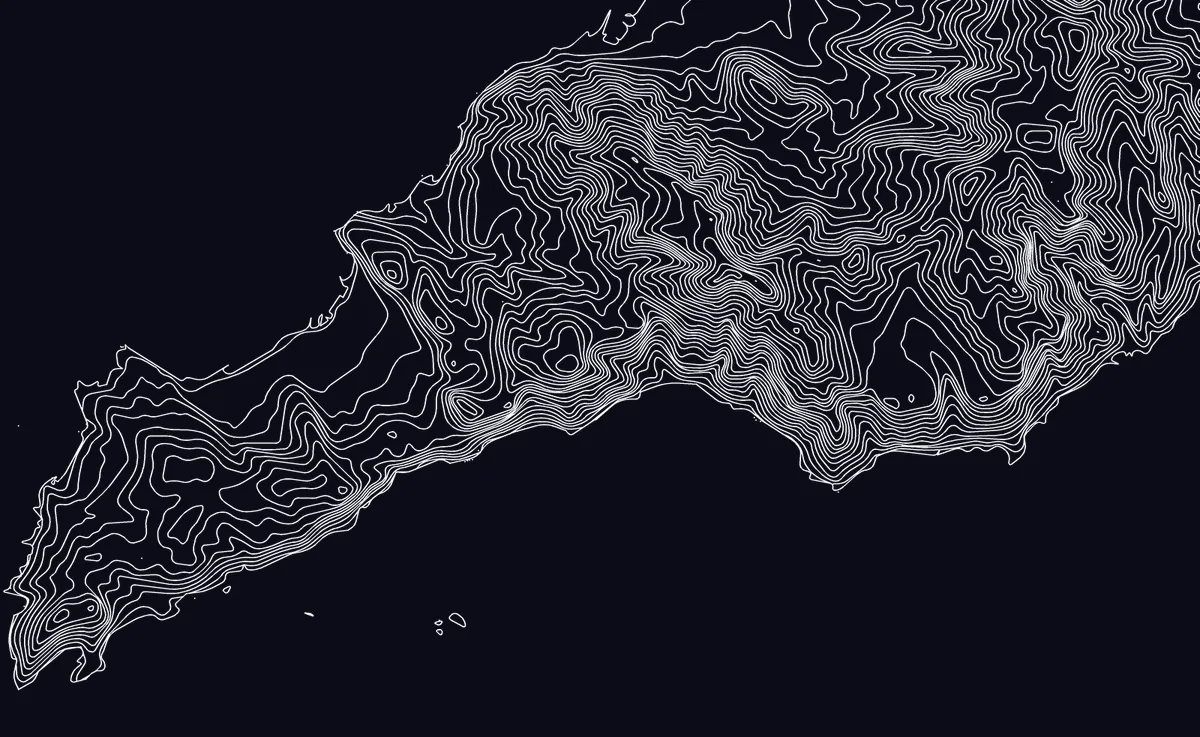
Real terrain, not a filter
Every line is traced from actual elevation data — GEDTM30 30 m bare-earth, or 10 m DEM on Pro. Coastlines, sea level and ridgelines land where they really are.
Create topographic contour maps from real elevation data — free, in your browser. Sign in with Google to generate contour lines for any place on Earth and export PNG or SVG.
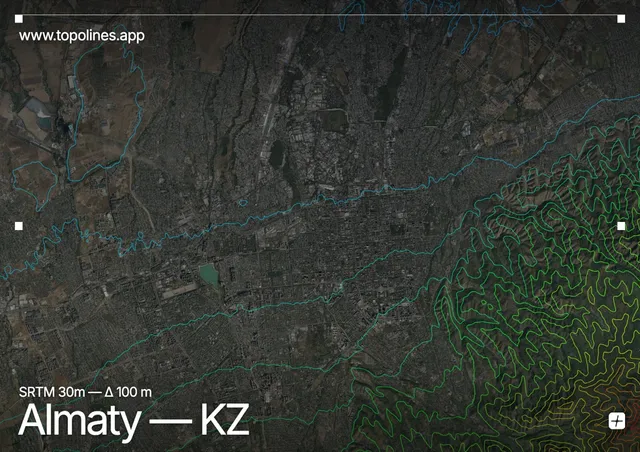
Three steps, no GIS.
Search a city or drop a pin. TopoLines pulls the elevation data for the frame you drew.
Set the interval, colour and line weight. The map redraws live as you go.
Take a PNG for the web, or a vector SVG that opens straight in Figma.
Every line is traced from actual elevation data — GEDTM30 30 m bare-earth, or 10 m DEM on Pro. Coastlines, sea level and ridgelines land where they really are.
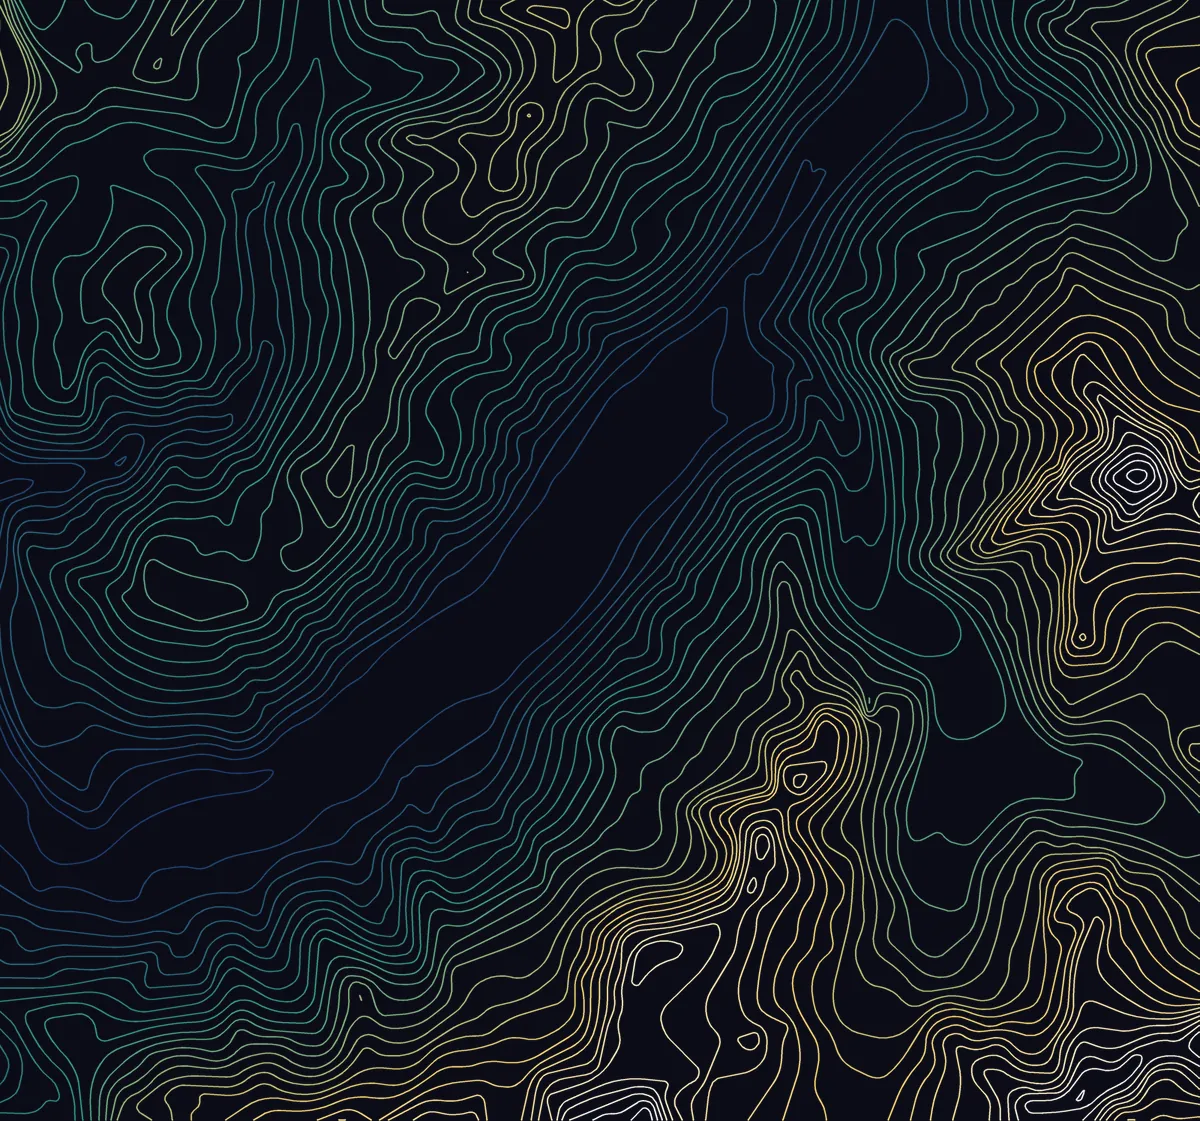
Map elevation onto a colour ramp — valley floors one colour, summits another. Use a built-in ramp or set your own stops.
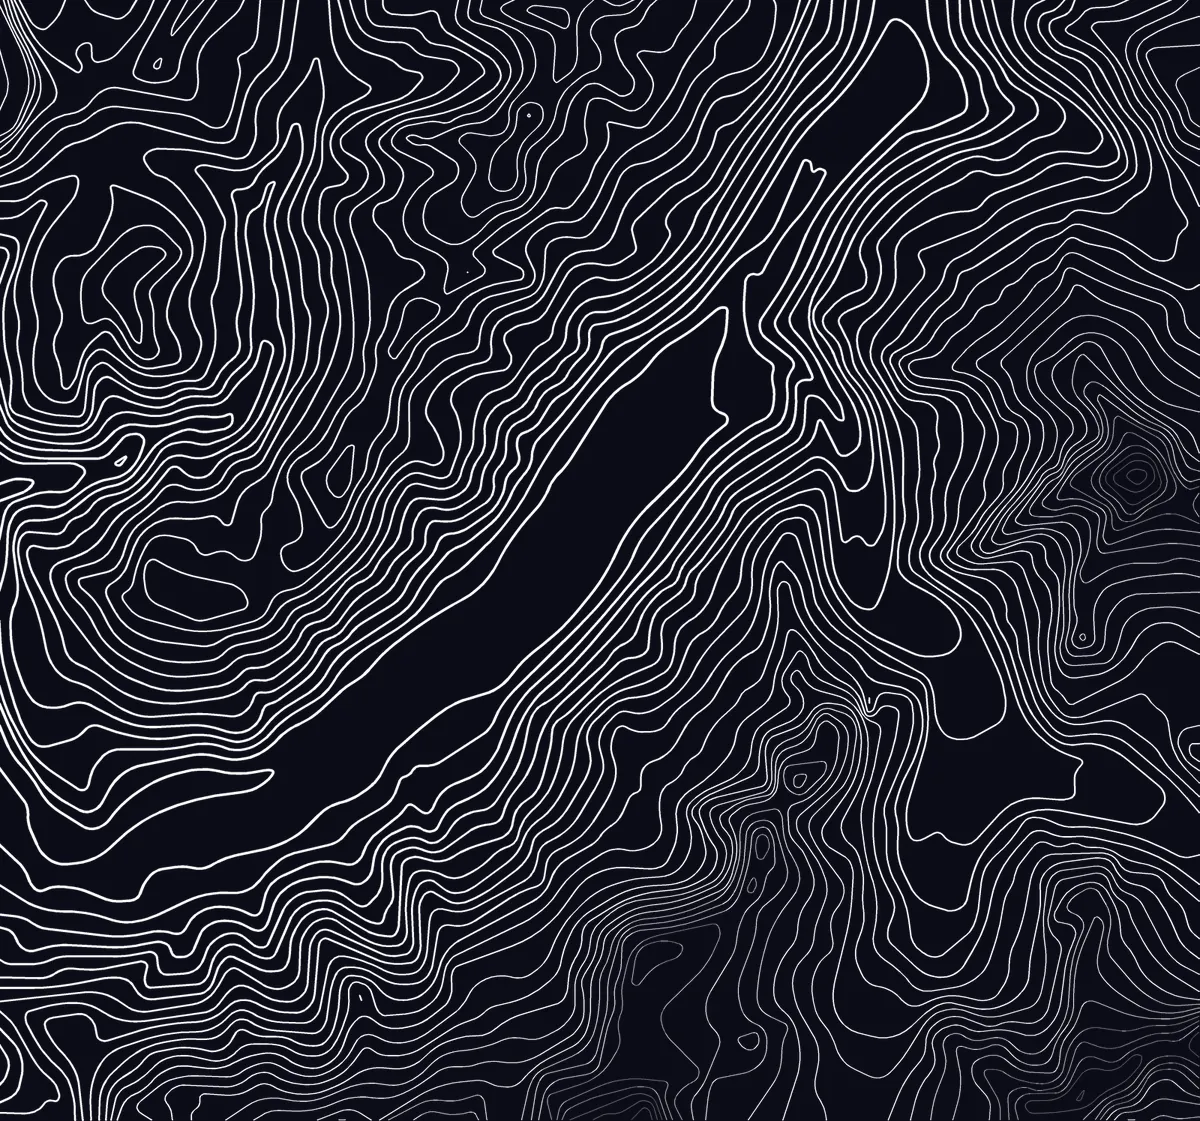
Taper thickens strokes with altitude, so high ground reads heavier than the valley. It turns a flat line drawing into something with depth.
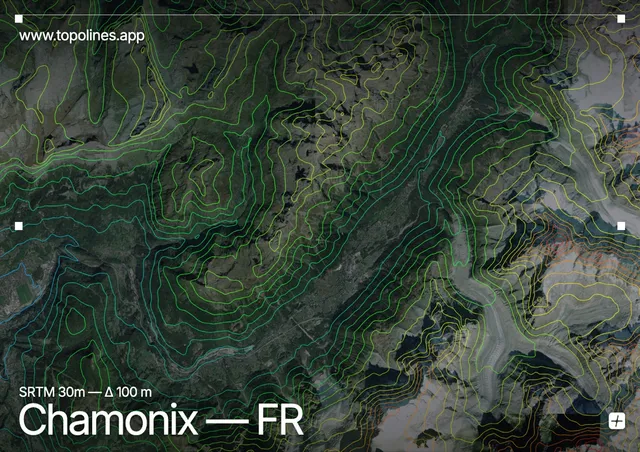
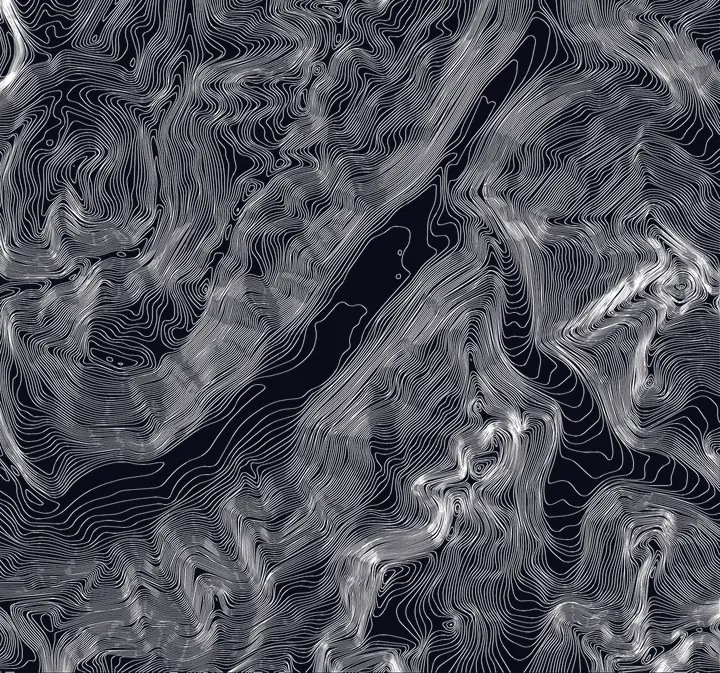
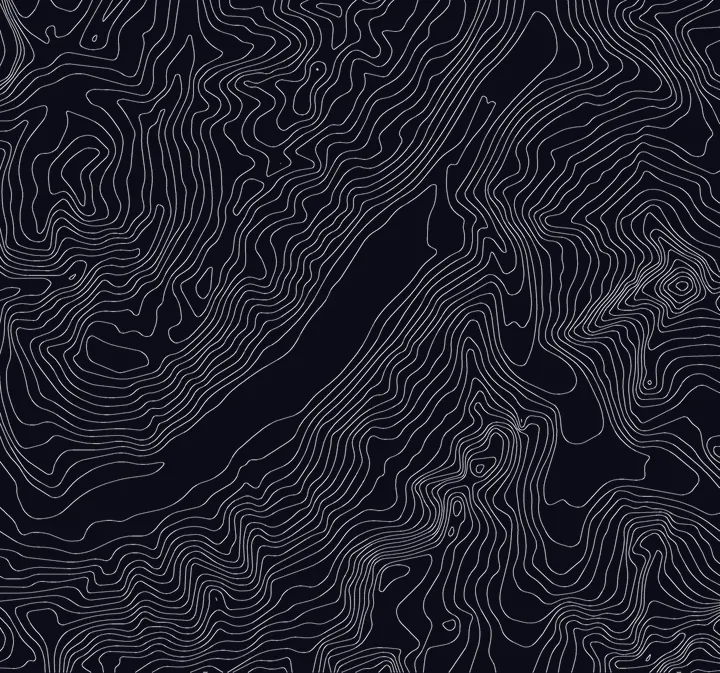
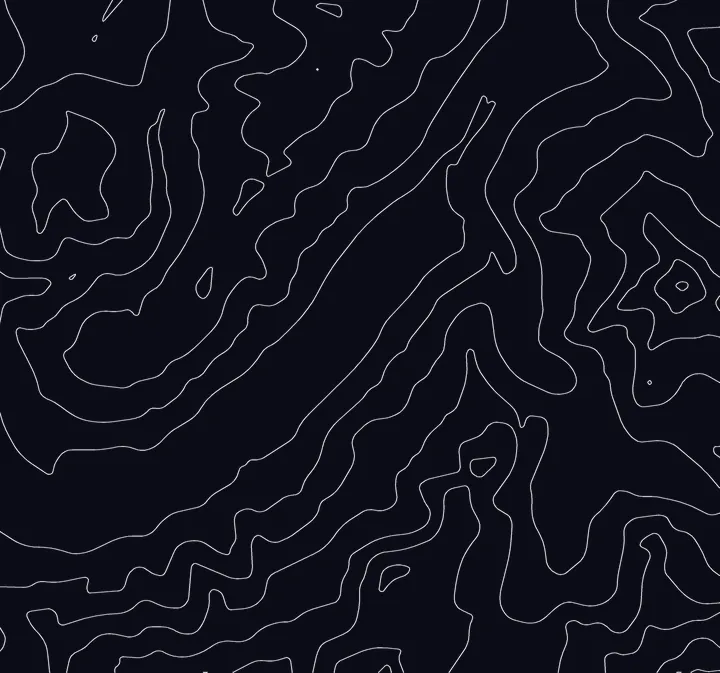
The interval is the height gap between adjacent lines, and it changes the result more than any other setting. Here is the Chamonix valley — 3,800 m of relief — rendered three times. Match the interval to the relief: flat ground needs a tight one to show anything, tall ranges need a wide one to stay readable.
Both draw contours. They are built for different jobs.
| Task | TopoLines | QGIS / ArcGIS |
|---|---|---|
| Getting elevation data | Built in, for anywhere on Earth | Find and download a DEM yourself |
| Setup | Open a browser tab | Install the app, add plugins |
| Styling | Live preview, colour ramps, taper | Restyle afterwards in a vector editor |
| Export | Clean PNG or layered SVG | Export, then clean up the topology |
| Best at | A finished, good-looking map, fast | Spatial analysis and precision GIS work |
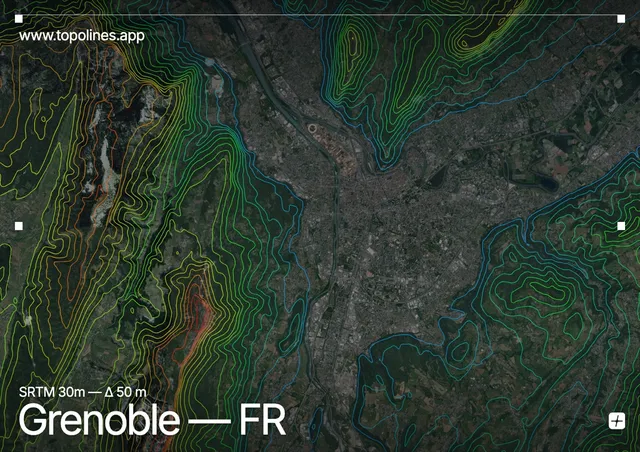
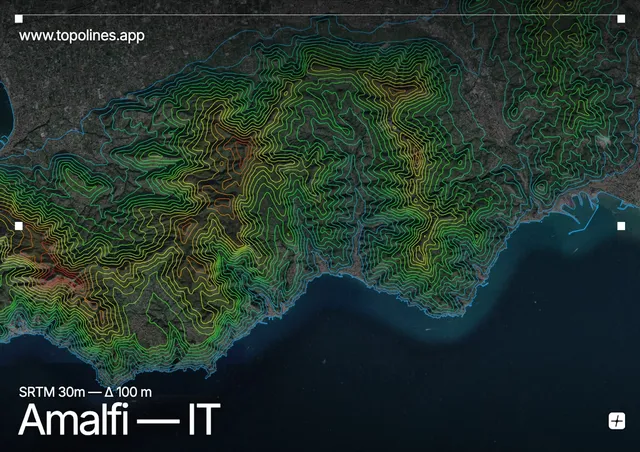
Every one of these was generated from real terrain data. Open any to see the place page, or make your own.
A contour map generator turns elevation data into a map of contour lines — curves that connect points of equal height. TopoLines does this automatically: you choose a location and interval, and it traces the contour lines from real terrain data, then lets you export the result as PNG or SVG.
Yes. Sign in with Google for free and generate a PNG for any location. A paid plan unlocks high-resolution PNG, vector SVG export, finer 10 m elevation data and larger areas.
Open the editor, search for the place or drop a pin, then frame the area you want. TopoLines fetches the elevation data and draws the contour lines instantly. Adjust the interval and colours until it looks right, then export.
Yes. TopoLines renders a clean, layered SVG where each contour is a real vector path — perfect for scaling to poster size or editing in Figma, Illustrator or Inkscape. SVG export is a paid feature.
A topographic map shows the shape of the land, most often using contour lines to represent elevation. Contour lines are the core of a topographic map, so a contour map generator is effectively a topographic map generator focused on that relief.
Open digital elevation models. Free exports use GEDTM30, a global bare-earth terrain model at 30 m resolution, which is plenty for posters and stylised art. Paid exports use 10 m GeoTIFF data, which resolves noticeably finer ridgelines and drainages — worth it when the terrain itself is the subject.
Match it to the terrain. A tight 5–10 m interval suits flat or highly detailed areas, a medium 20–50 m interval is a safe default for posters, and a wide 100 m+ interval keeps tall mountains readable.
No. The generator handles the elevation processing and vector output for you, so you skip the DEM sourcing, contour tooling and topology cleanup that a GIS workflow requires.
Free PNG with a Google account. Upgrade for HD and SVG when you are ready.
Open the contour map generator