
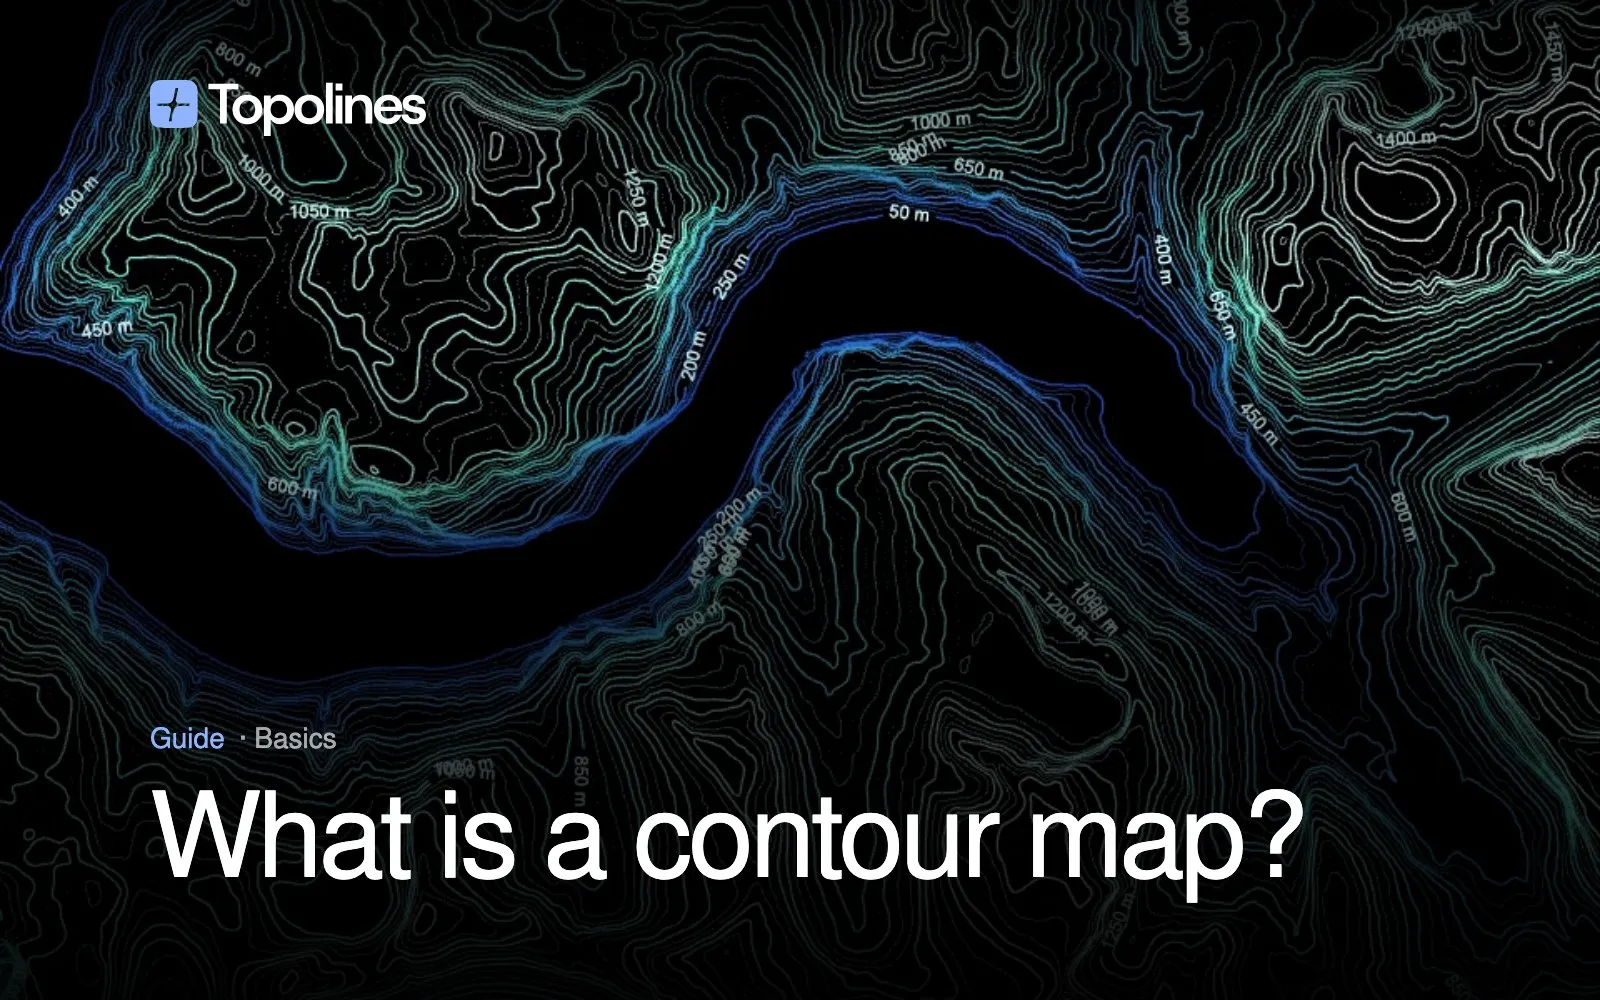
A contour map is a map that shows the shape of the land with contour lines — lines that connect points of equal elevation. Each line is one height above sea level, so together they turn a flat sheet into a readable 3D landscape: where the lines bunch up the ground is steep, where they spread out it’s flat, and closed loops mark hills and hollows.
This guide explains what a contour map is, what contour lines (also called topo lines, topography lines or topographic lines) mean, the rules they always follow, and how to read peaks, ridges, valleys and slope at a glance — with real examples generated from elevation data. At the end, you’ll see how to make a contour map of any place in a couple of minutes.
Make a contour map of any place →
What is a contour map?
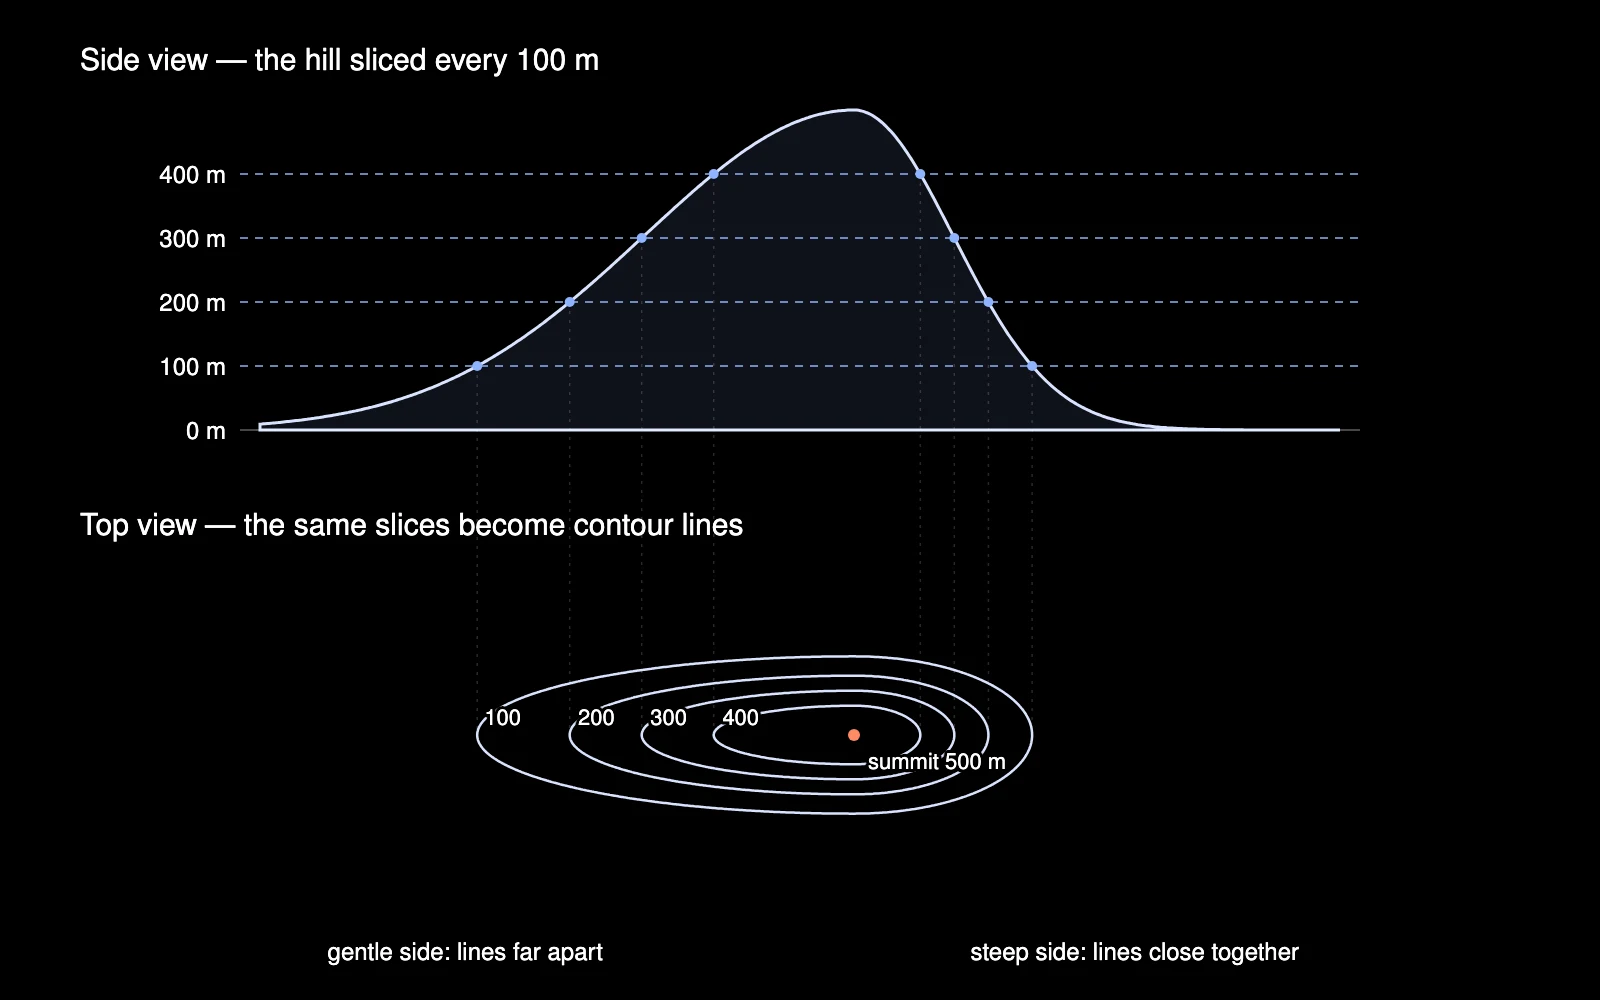
A contour map represents terrain from above. Instead of shading or colour, it uses contour lines: each line traces a path along which the ground is at exactly the same height. Walk along a contour line in real life and you’d never go up or down.
The idea is easiest to picture with a mountain. Slice it horizontally every 10 metres, like a stack of pancake layers, and trace the outline of each slice onto paper. You get a set of nested loops — that’s a contour map. The innermost loop is the summit; each ring outward is 10 m lower.
Contour map vs topographic map
The terms overlap, but they’re not identical:
- A contour map shows elevation with contour lines — the lines are the map.
- A topographic map (definition: a detailed map of the land’s surface) uses contour lines for relief plus everything else: roads, rivers, buildings, forests, place names, grid lines. The USGS quad sheets and national survey maps are topographic maps.
In other words, every topographic map contains a contour map, but a contour map can be just the lines — which is exactly what makes it useful for analysis, planning and design.
What are contour lines?
Contour lines are the curved lines on a contour or topographic map that connect points of equal elevation. “Topography lines”, “topographic lines”, “topo lines” and “elevation lines” all mean the same thing.
Every contour line carries one elevation value. On most maps there are three kinds:
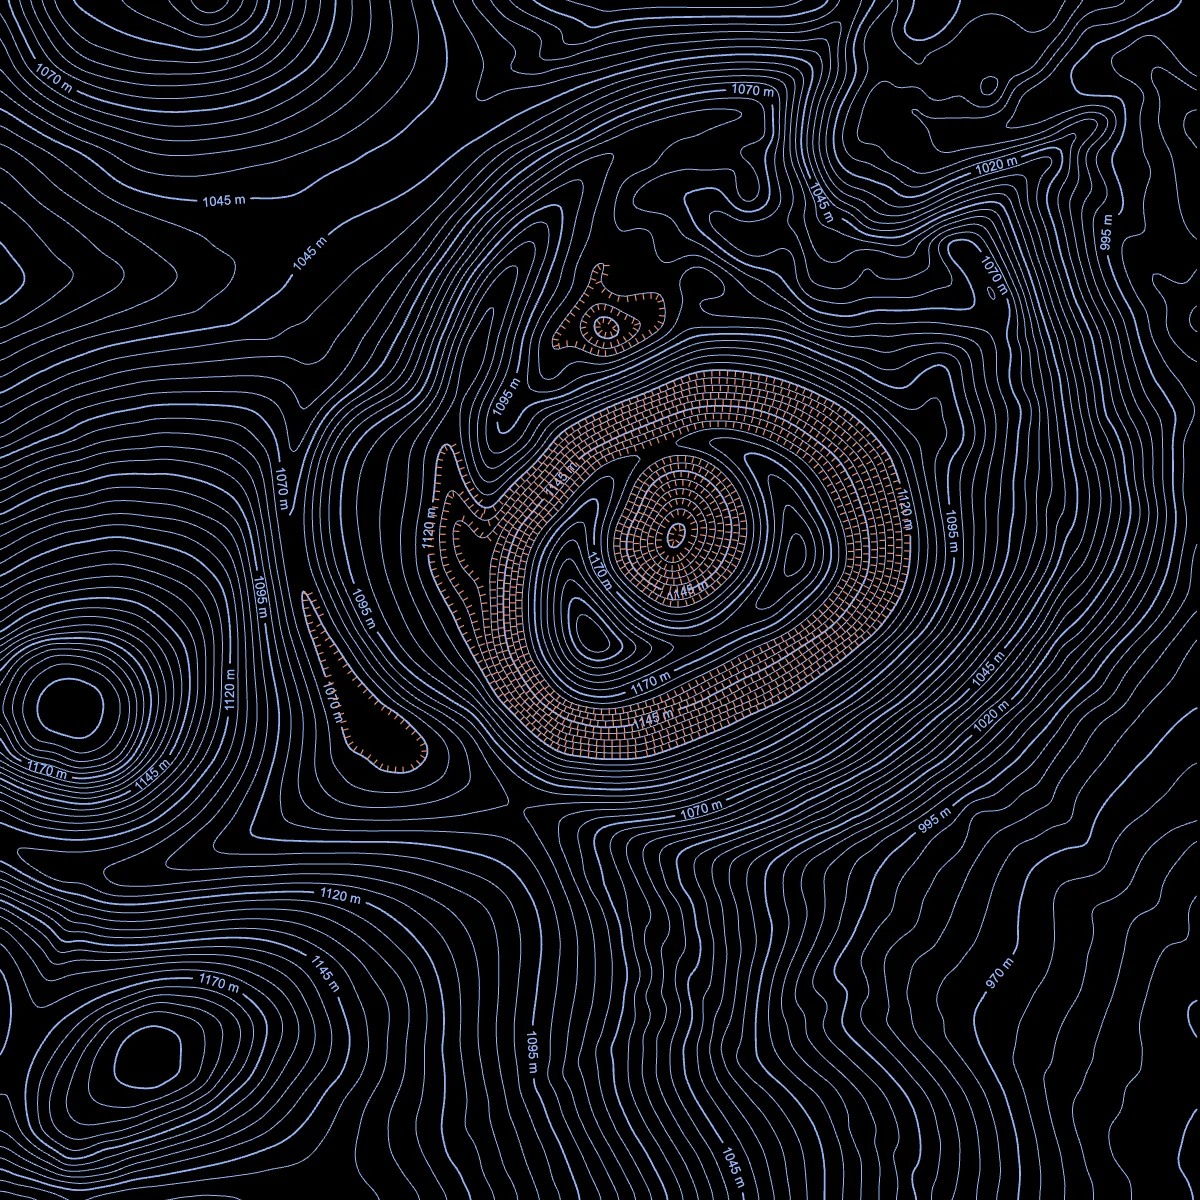
- Index contours — every fifth line, drawn heavier and labelled with its height (e.g. 500 m, 600 m). They’re your reference points.
- Intermediate contours — the thinner, unlabelled lines between index contours. You get their height by counting up or down from the nearest index line.
- Supplementary contours — dashed lines at half the interval, added only on flat ground where the normal lines are too far apart to show the shape.
Closed contours around a hollow (a crater, a sinkhole) carry short tick marks — hachures — pointing downhill into the depression, so you can’t mistake it for a hill.
The contour interval
The contour interval is the constant height difference between one line and the next. It’s printed in the map legend (“contour interval 10 m” or “20 ft”).
If the interval is 10 m, crossing four lines uphill means you’ve climbed 40 m — no matter how far you walked horizontally. That’s what makes contour maps so powerful: distance on the page becomes height in the real world.
The interval also controls how the map looks. The same terrain with a tight and a wide interval:
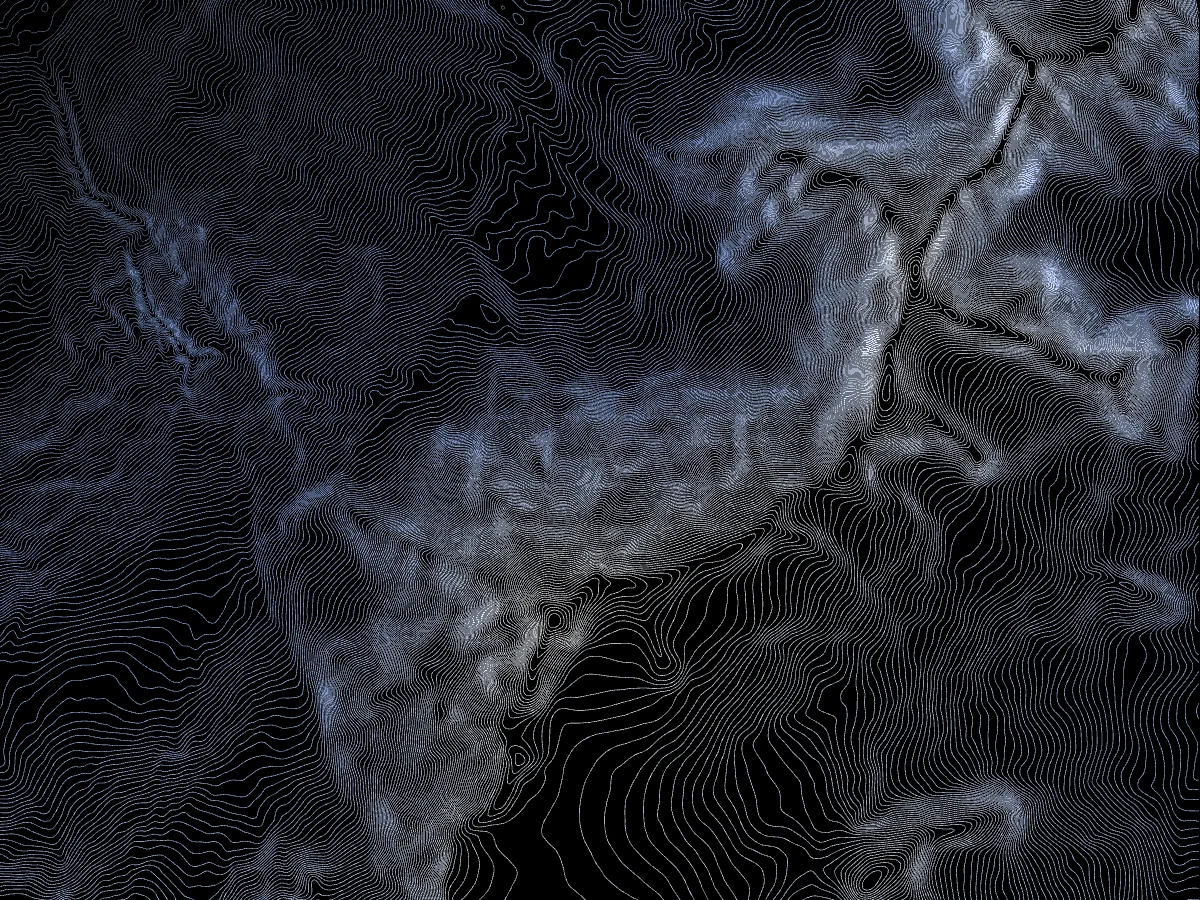
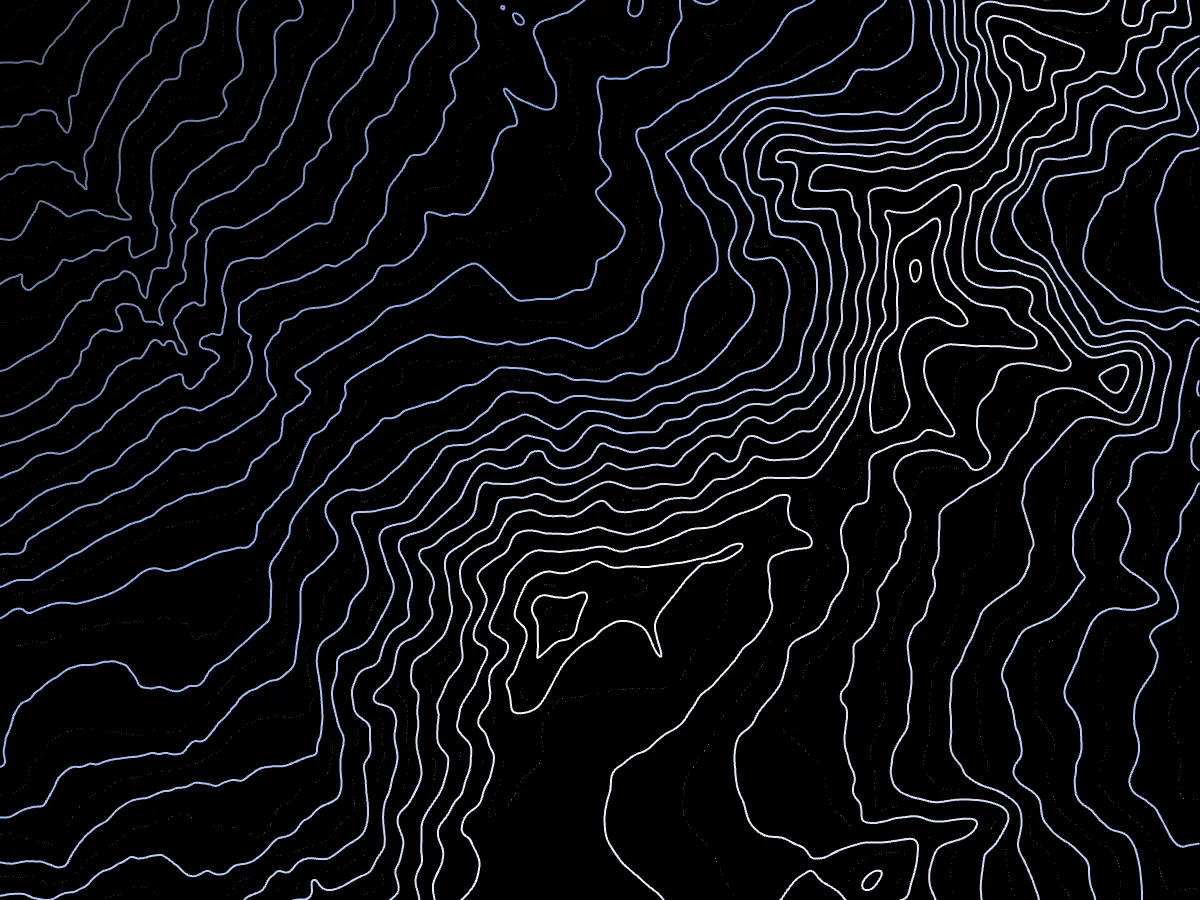
Rule of thumb: flat regions use small intervals (1–5 m) so the map isn’t empty; mountain maps use larger ones (20–100 m) so it isn’t solid black.
How to read a contour map in 5 steps
- Find the interval in the legend, and the labelled index contours.
- Find the high and low points. The smallest closed loops are summits (or depressions, if they carry tick marks). Water and the lowest index labels mark the low ground.
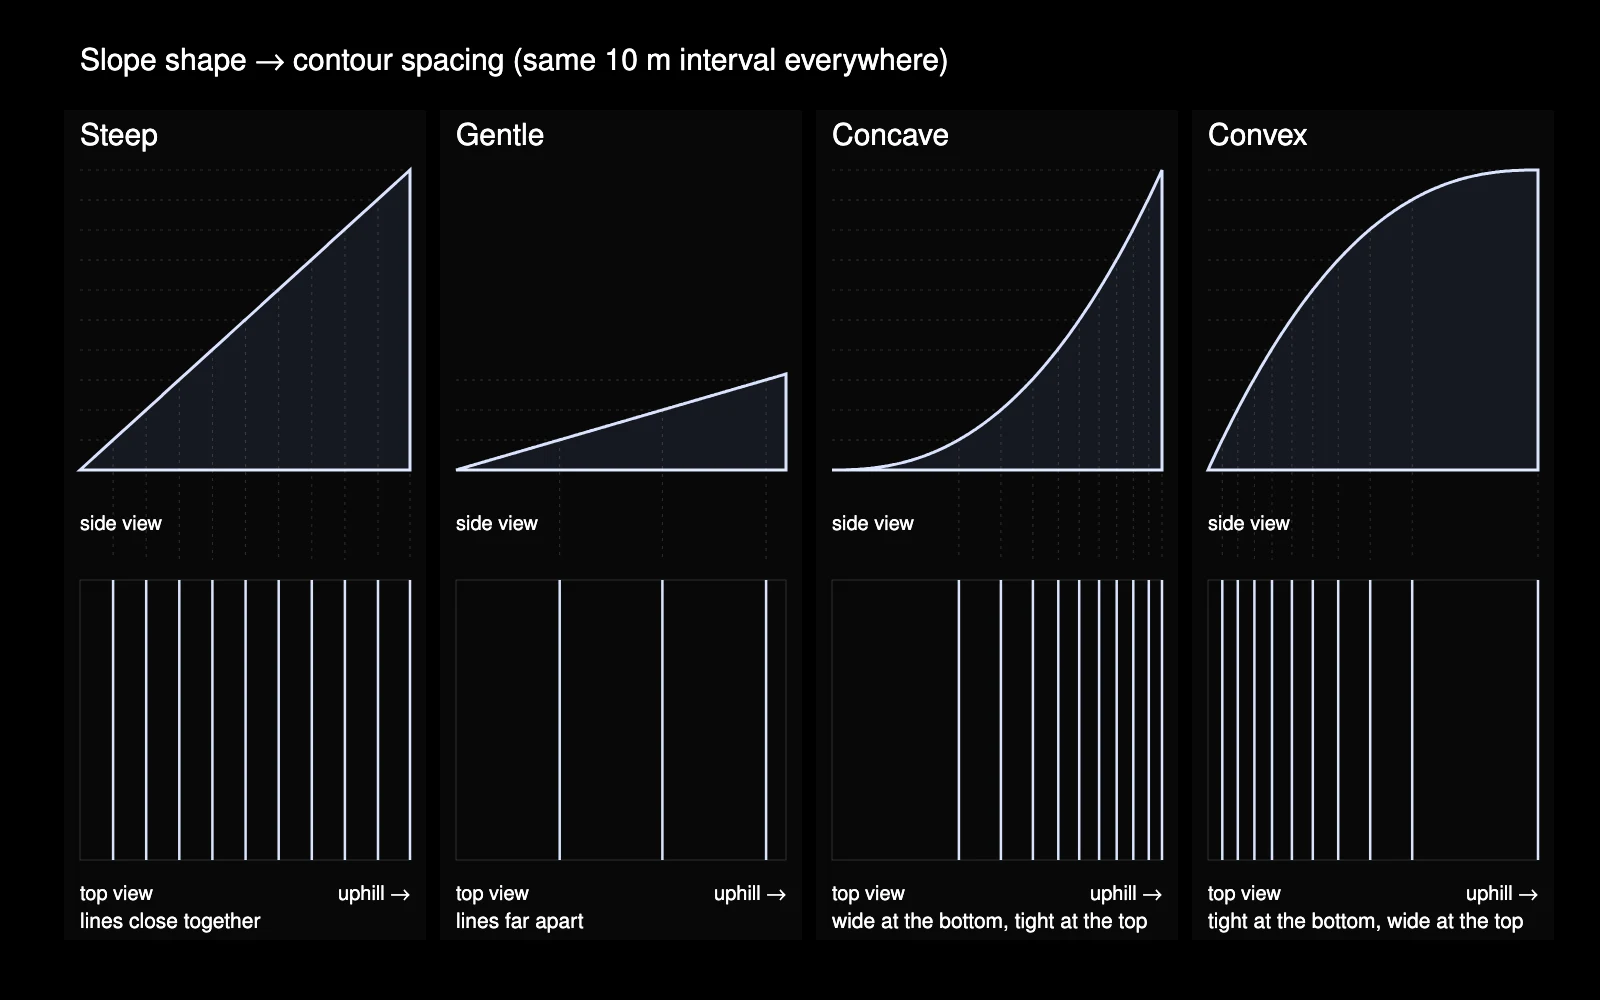
- Read slope from spacing. Lines close together = steep. Lines far apart = gentle or flat. Evenly spaced = a uniform slope.
- Read the V’s. Where lines bend into a V or U, you’re crossing a valley or a ridge (see below).
- Count lines for elevation. From the nearest index contour, count lines and multiply by the interval to get the height of any point.
The rules of contour lines
Contour lines aren’t drawn freehand — they obey a strict set of rules. Every contour map in the world follows them:
- Contour lines never cross. One point on the ground can’t be at two heights. The only apparent exception is an overhanging or vertical cliff, where lines touch or stack.
- Every line closes on itself — even if the loop runs off the edge of the map before you see it complete.
- The interval is constant across one map, which is what lets you read slope from spacing.
- Closed loops are peaks or depressions. Concentric rings rising inward are a hill or summit; with tick marks, they’re a hollow.
- Lines bend upstream in valleys and downhill on ridges.
- Lines never split or merge. A contour is a single continuous line.
Reading slope: what the spacing tells you
The distance between contour lines is the most useful thing on the map, because it encodes the gradient:
- Close together = steep ground. Lots of height in a short distance: cliffs, steep faces, gorges.
- Far apart = gentle ground. Plains, plateaus, valley floors.
- Close at the top, wide at the bottom = concave slope (steep then flattening — typical of mountainsides).
- Wide at the top, close at the bottom = convex slope (a rounded top that drops away — you can’t see the bottom from the top).
Reading landforms: peaks, ridges, valleys, saddles
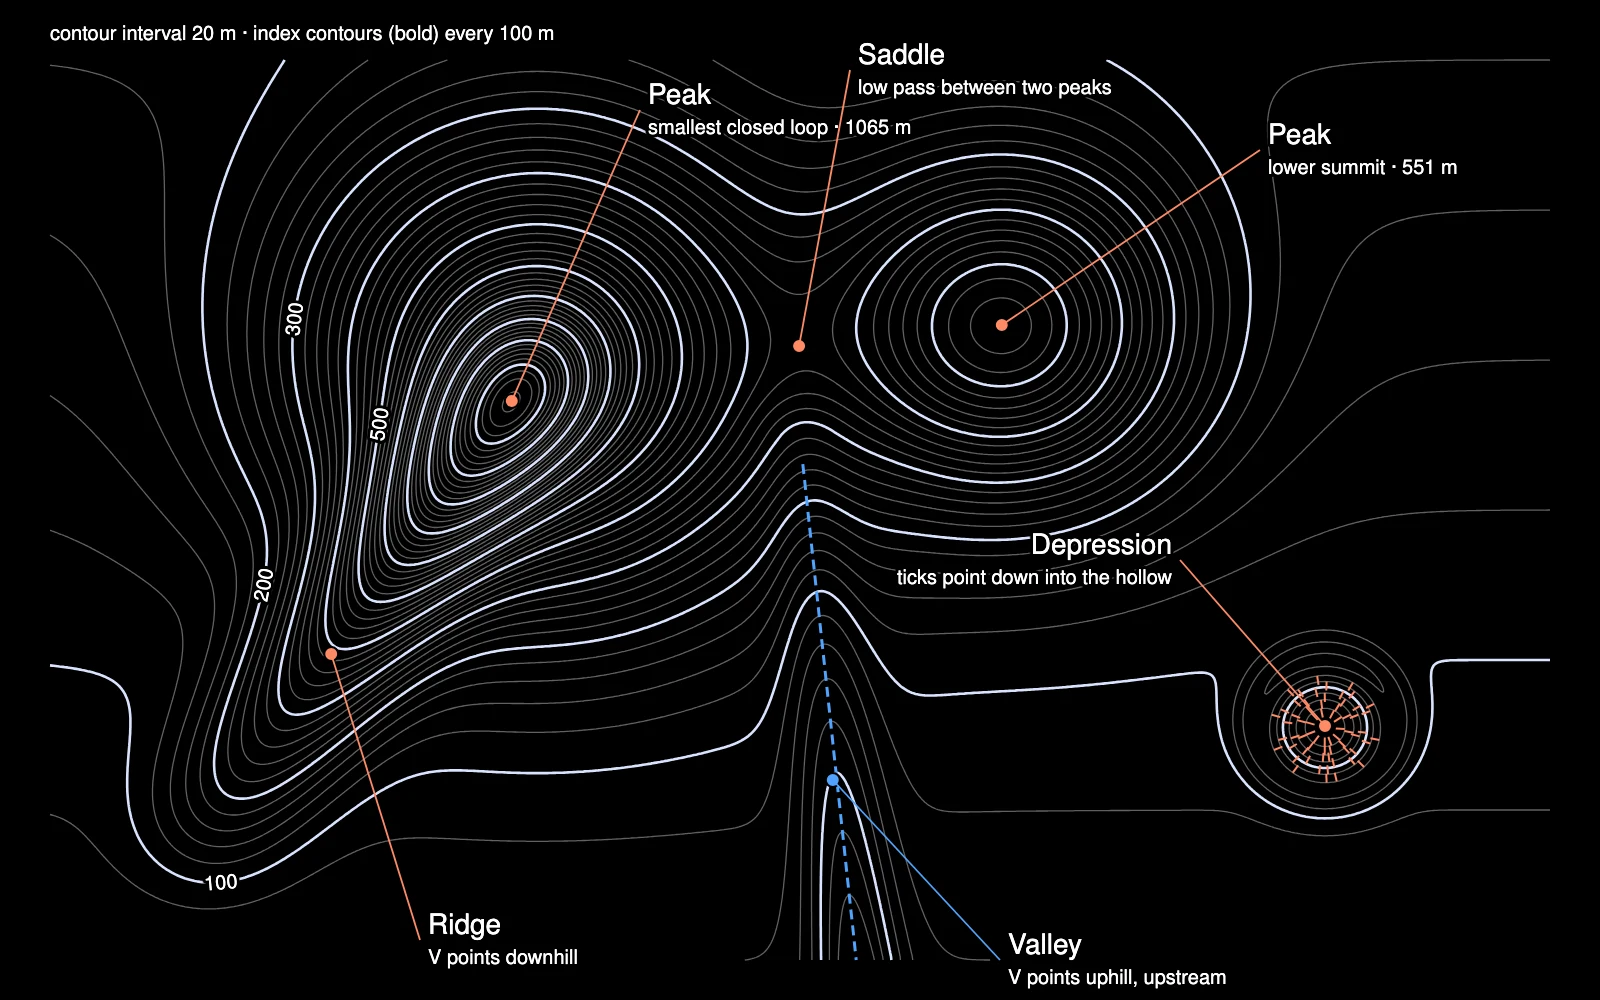
Five shapes cover almost everything you’ll see on a contour map:
- Peak / hill — a set of closed, concentric loops; the smallest one is the top.
- Depression — closed loops with tick marks pointing inward and downhill.
- Valley — contour lines form a V pointing uphill (upstream). Water runs along the bottom of the V. Rule of thumb: the V points back upstream.
- Ridge — contour lines form a V or U pointing downhill, wrapping around the spine of high ground.
- Saddle (col, pass) — the low point between two peaks, where two sets of loops face each other and the lines pinch in like an hourglass.
Quick test on any V: if it points toward higher ground, it’s a valley; toward lower ground, it’s a ridge.
What contour maps are used for
- Hiking and navigation — plan routes, estimate climbs, avoid cliffs.
- Architecture, landscaping and site planning — grading, drainage, building placement (usually as DXF in CAD).
- Farming and permaculture — keylines, swales and water flow follow the contours.
- GIS and engineering — terrain analysis, watersheds, cut and fill.
- Design and making — posters, brand patterns, and laser-cut or 3D-printed layered maps. See the laser cut topographic map guide.
How to make a contour map of any place
You don’t need GIS software or survey data. Contour maps today are generated from digital elevation models (DEMs) — global grids of terrain height measured by satellite and aerial lidar. With the TopoLines contour map generator:
- Search for the place and draw a zone over it.
- Choose the contour interval (tight for detail, wide for clarity).
- Toggle index contours, labels, depression ticks or a colour ramp by height.
- Export as PNG (free), or SVG, DXF and GeoJSON for design, CAD and GIS.
The lines are traced from real elevation data — 30 m worldwide, and 10 m or finer national data in many countries — so they match the actual terrain. For the data sources, see high-resolution terrain.
FAQ
What is a contour map? A contour map shows the shape of the land using contour lines — lines that connect points at the same elevation. Their spacing shows slope and their shapes reveal peaks, ridges, valleys and depressions.
What are contour lines? Contour lines are lines on a map joining points of equal height above sea level. They’re also called topo lines, topography lines, topographic lines or elevation lines.
What do contour lines show? Elevation and the shape of the terrain. Each line is one height; how close the lines are shows how steep the ground is.
Can contour lines cross? No. A point can’t be at two elevations at once. They can only touch or stack at a vertical or overhanging cliff.
What does it mean when contour lines are close together? The ground is steep. Lines far apart mean gentle or flat ground.
What is the contour interval? The fixed height difference between two neighbouring contour lines, printed in the map legend — for example 10 m or 20 ft.
What is the difference between a contour map and a topographic map? A contour map shows elevation with contour lines. A topographic map uses contour lines plus roads, rivers, buildings, vegetation and names.
How do you tell a ridge from a valley? In a valley the V-shaped contours point uphill (upstream); on a ridge they point downhill.
How can I make a contour map for free? Use an online contour map generator such as TopoLines: draw an area anywhere in the world, pick an interval and export a PNG for free — no GIS software needed.
Turn any mountain, coast or valley into a contour map. Start free →