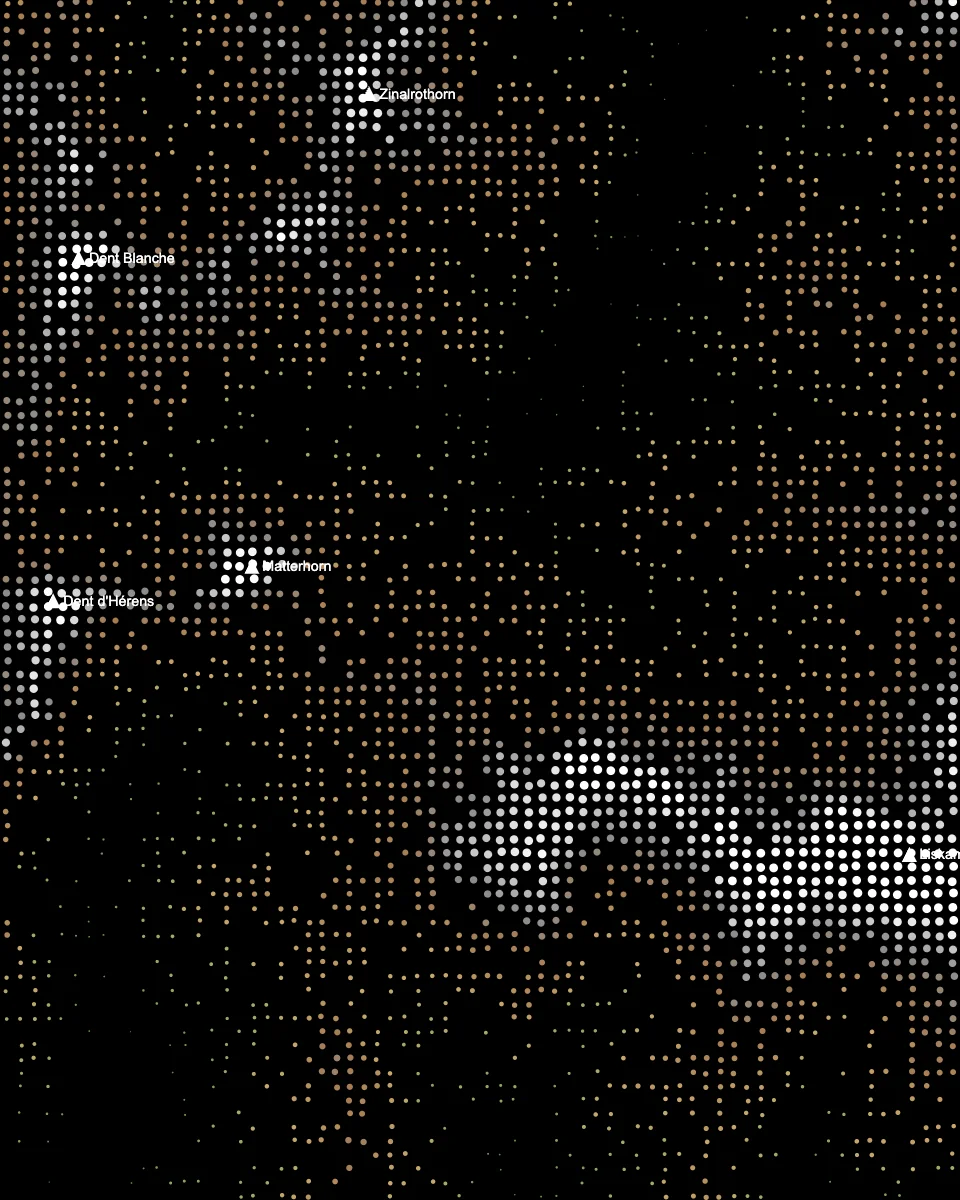
Alpine print
Imhof gradient, Loose placement.
TopoLines 2.0 is live
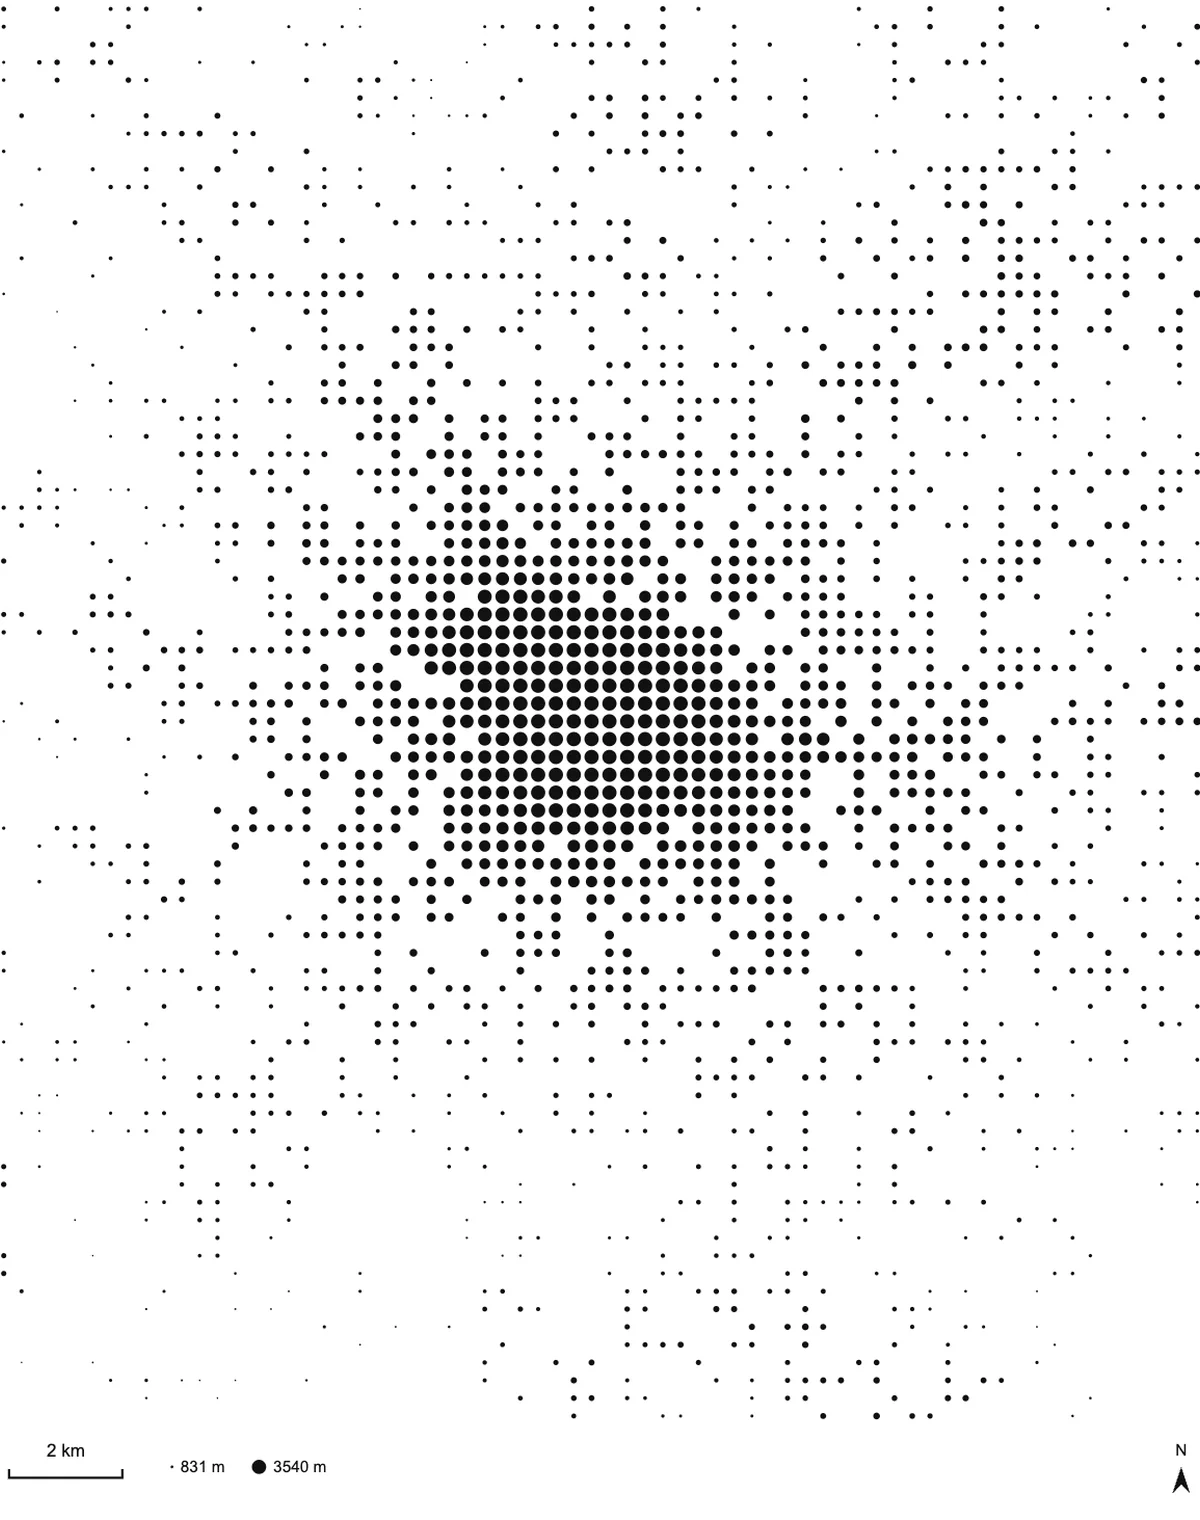
Discover PointsTurn real elevation data into a dotted map — each dot sized by the height of the ground beneath it. Free in your browser, for any place on Earth, exported as PNG or SVG.
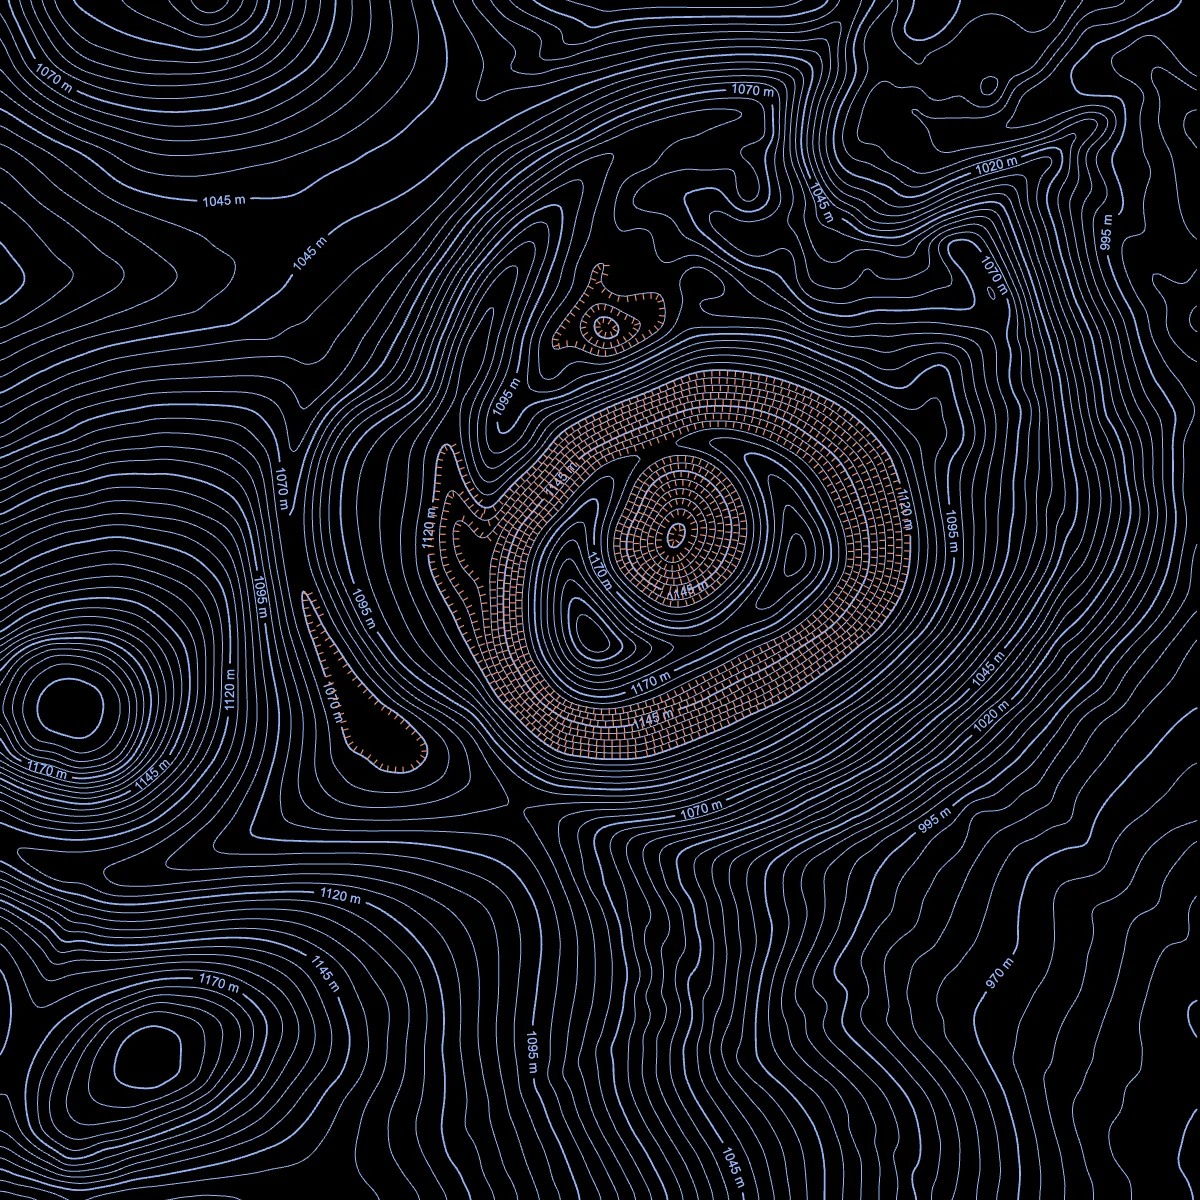
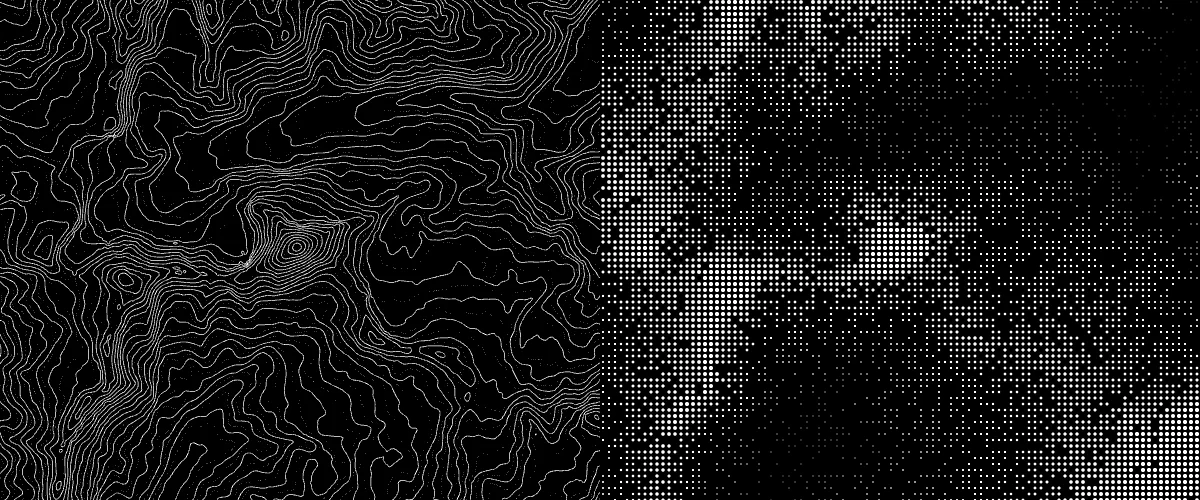
Lines trace where the ground reaches a height. Points show how high it is, dot by dot.
Exports
Imhof gradient, Loose placement.
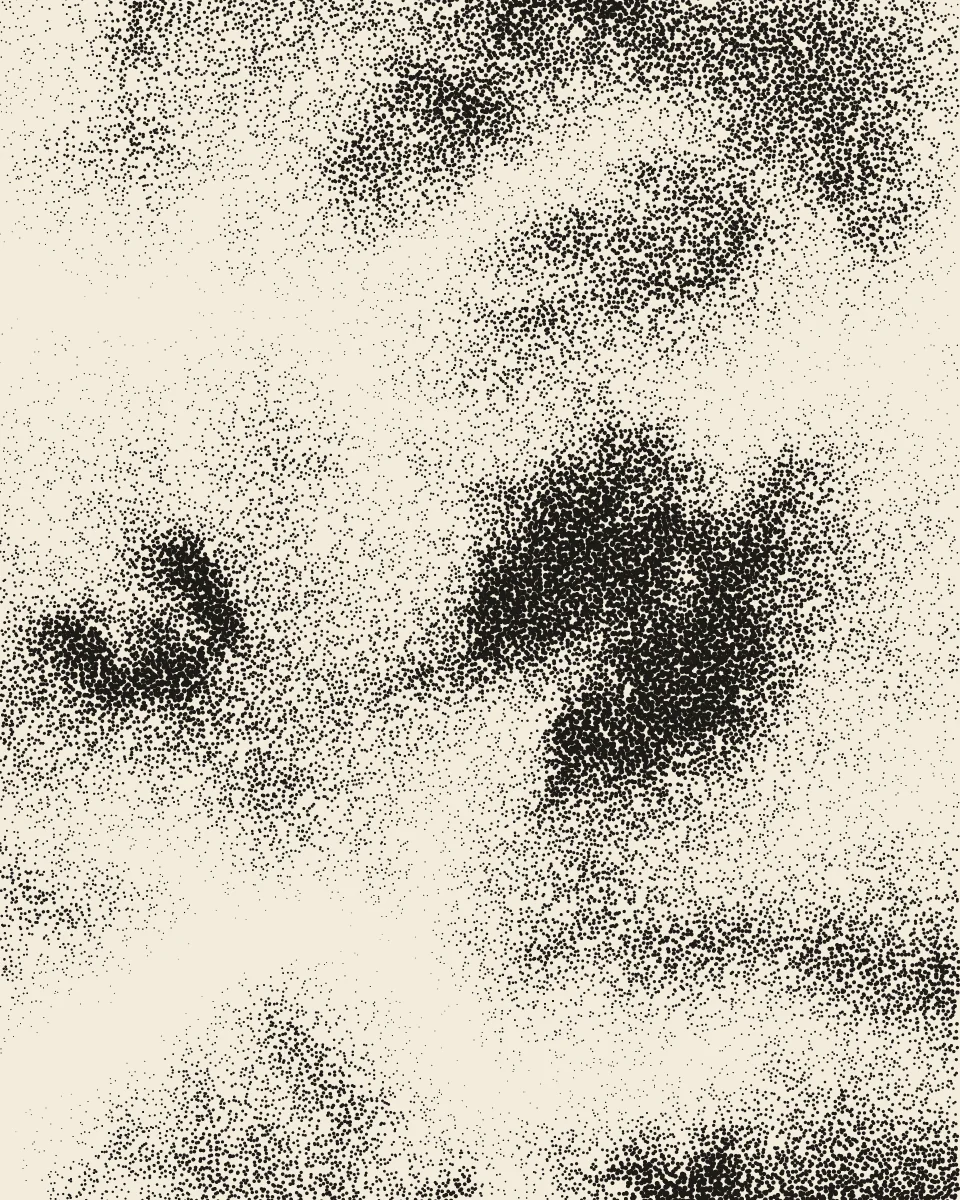
Scattered dots, one ink colour.
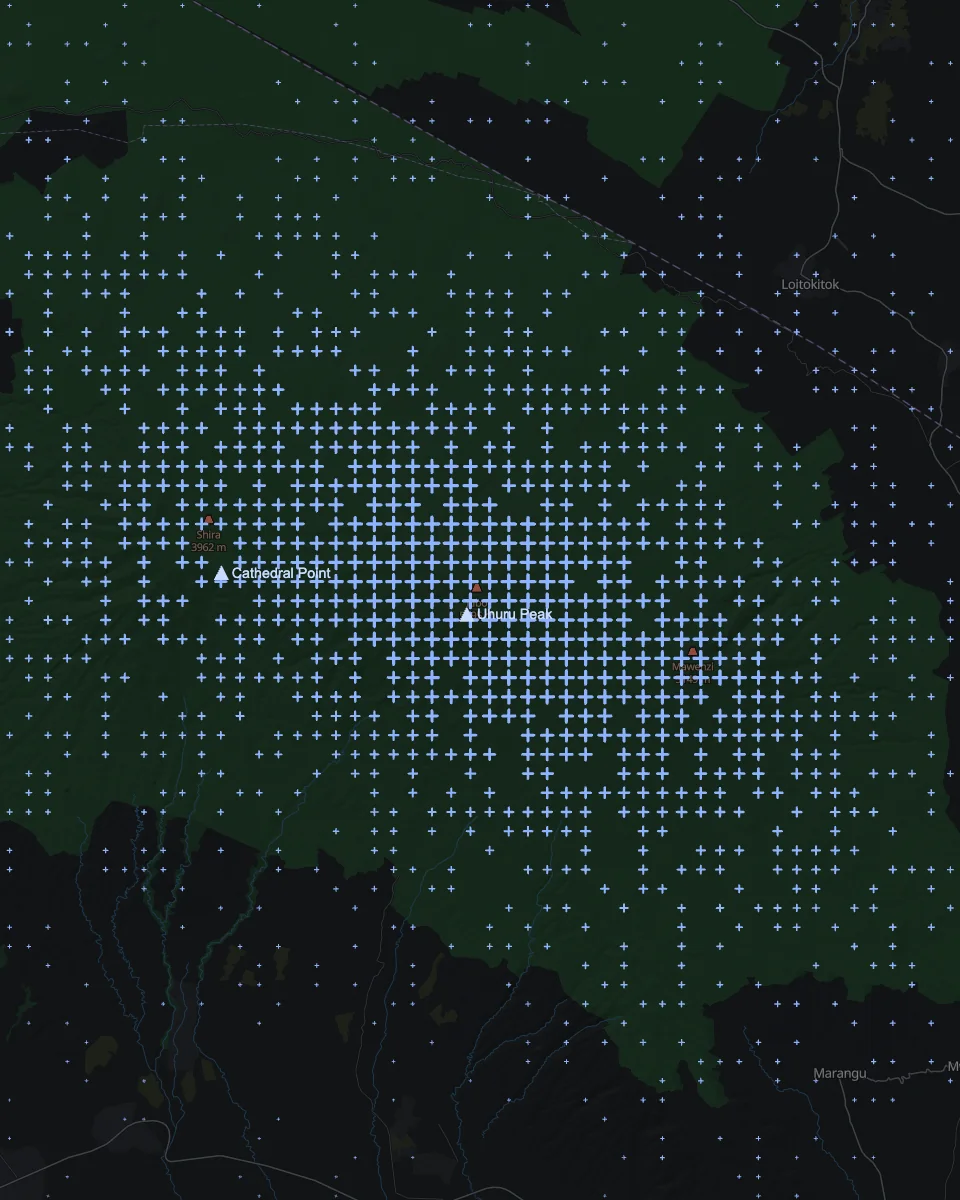
A trail or a summit, cropped tall.
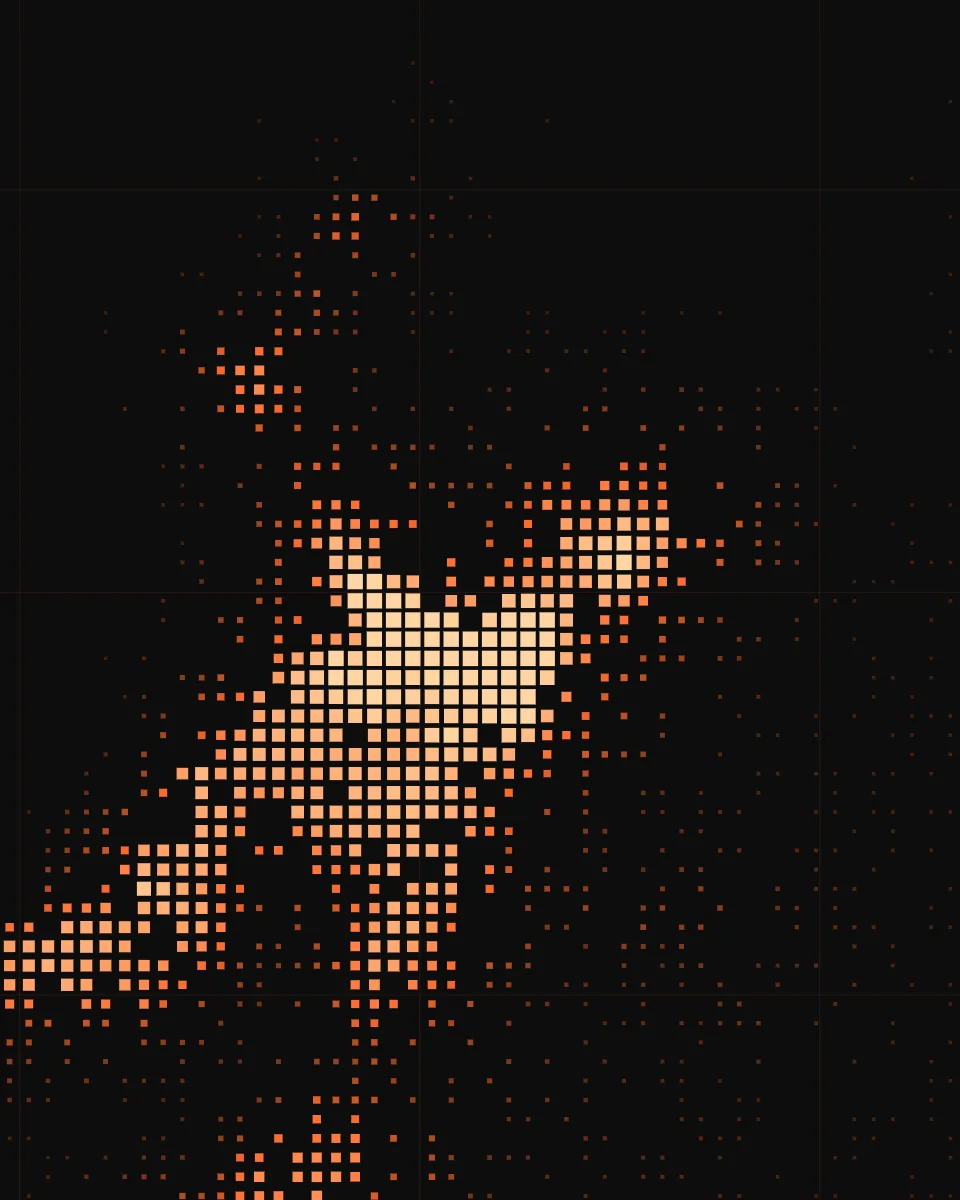
Squares tiled as a brand surface.
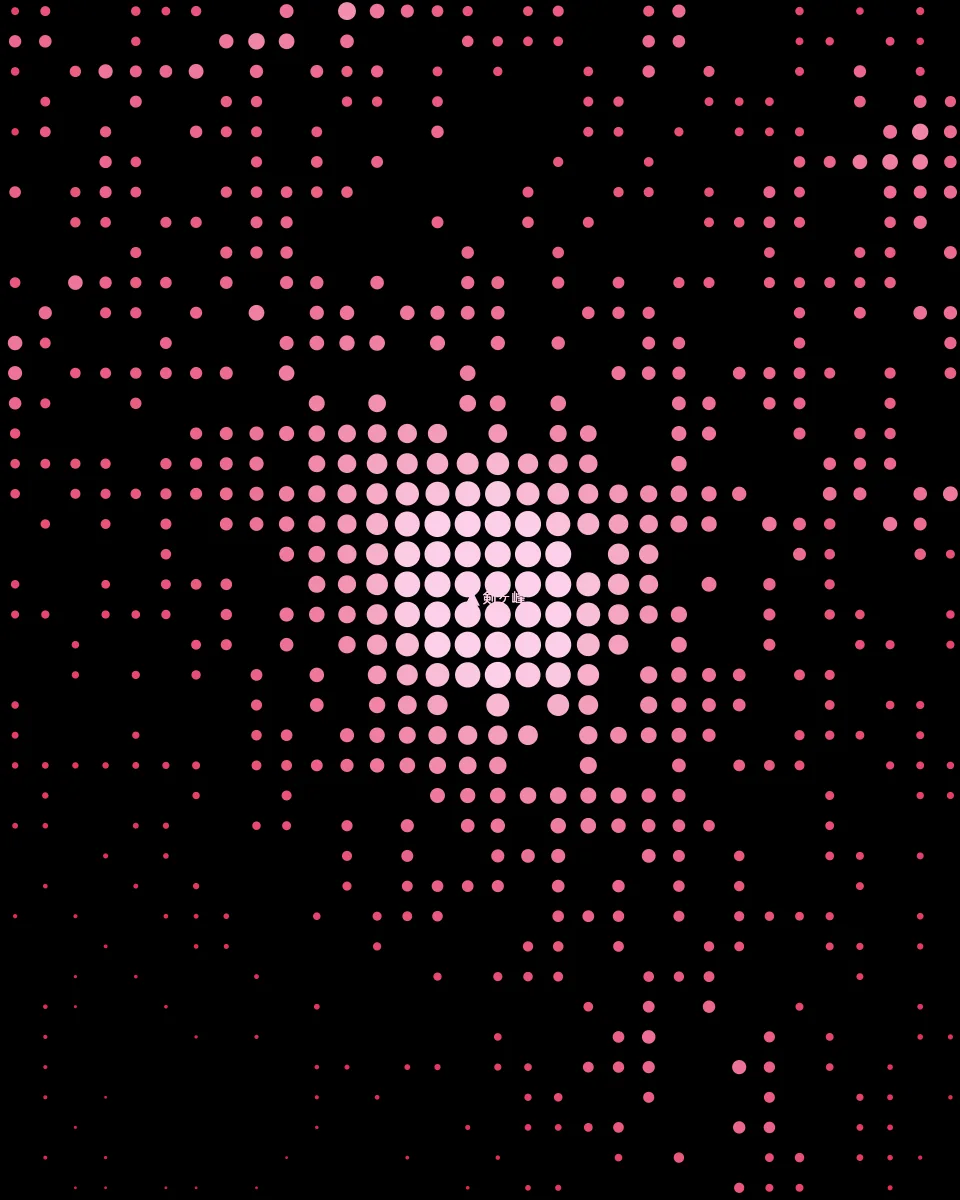
Big glyphs, a bold duotone.
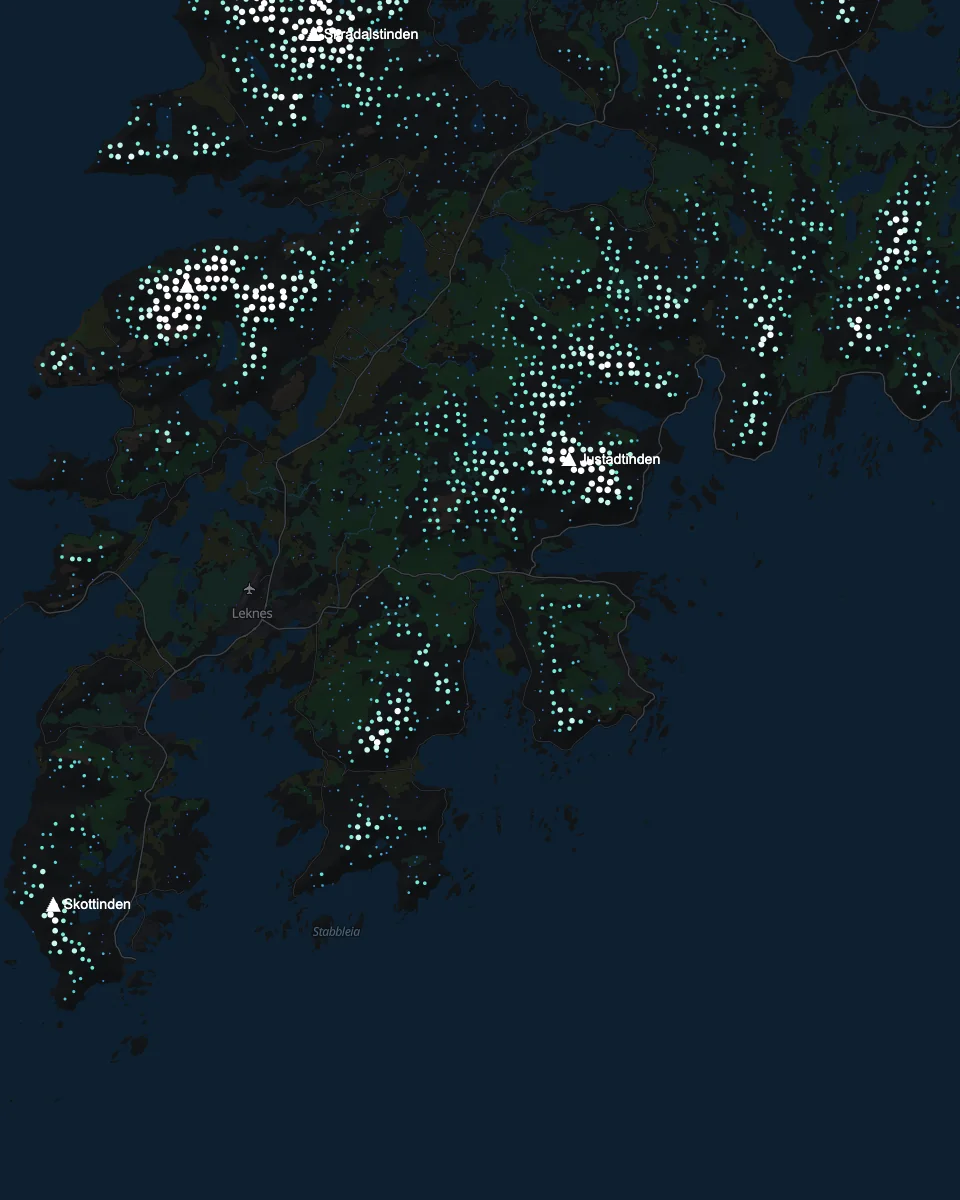
Tote, tee, mug — vector stays sharp.
Search a place or draw a frame on the map. Any terrain on Earth.
Same elevation data, one toggle. Lines turn into dots.
Density, shape, size, placement, colour. Live preview.
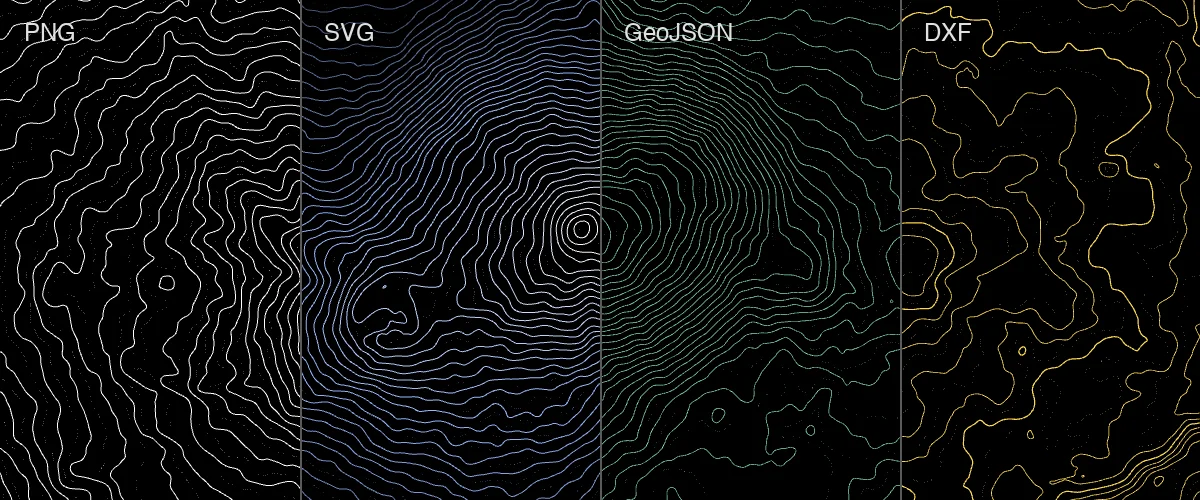
PNG up to 3200 px or SVG. Ready for print or screen.
Points works exactly like Lines. No separate plan. See pricing
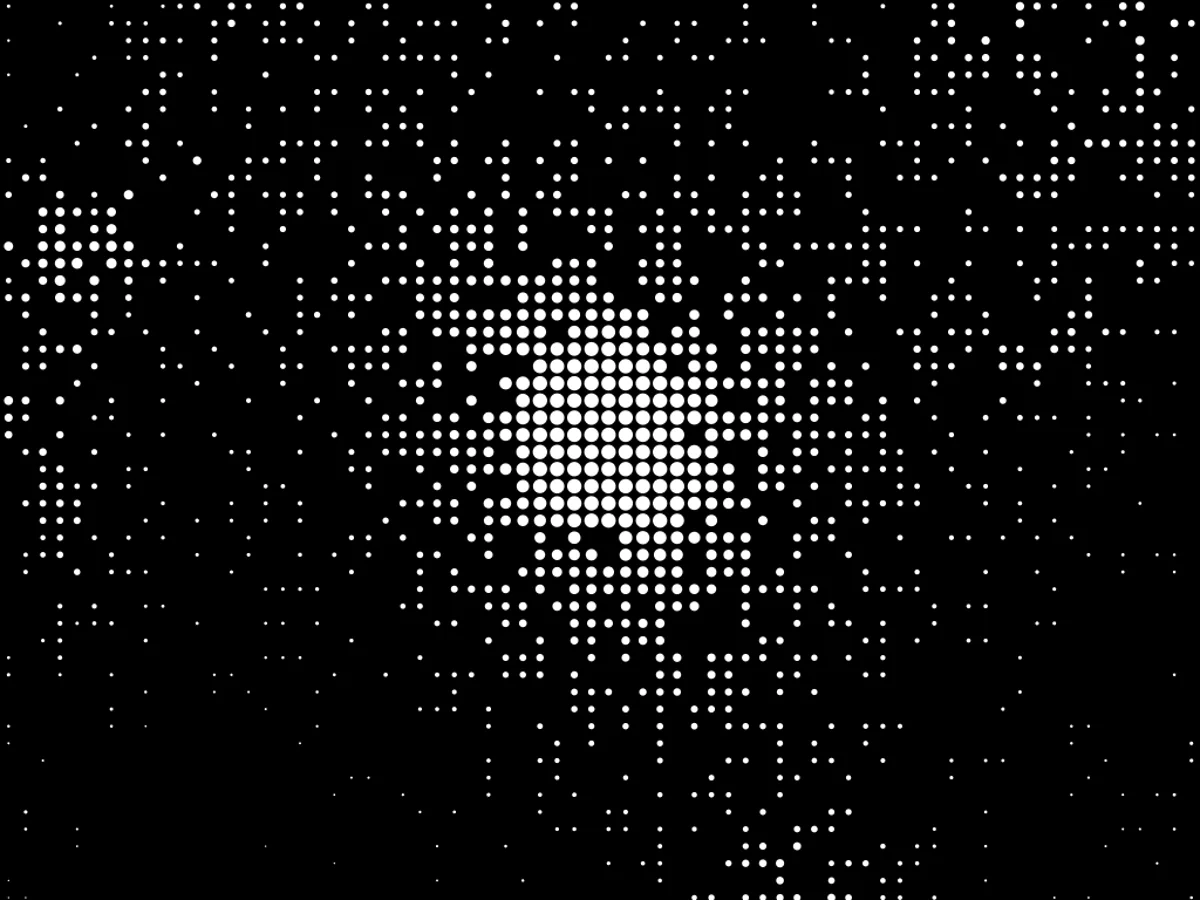
Free. Every Points control, one colour, standard PNG.
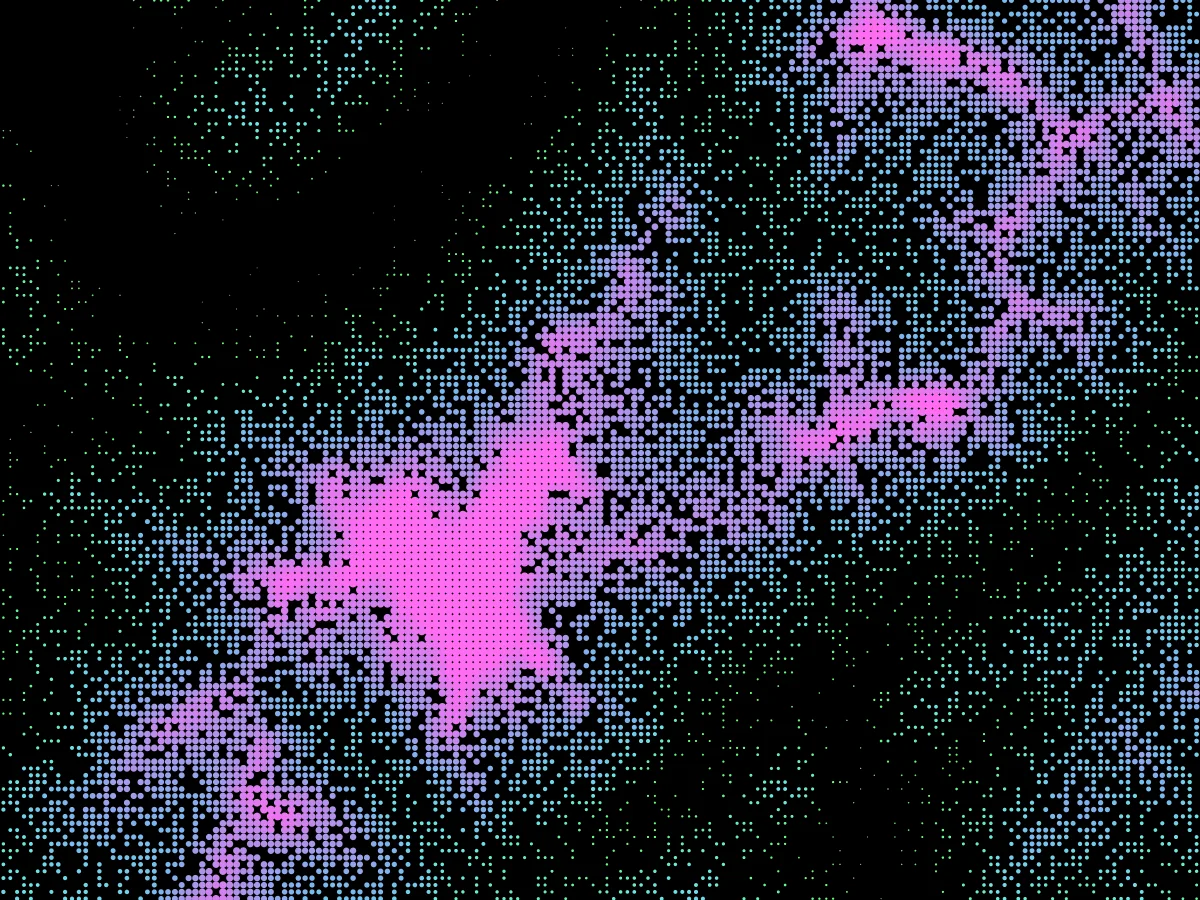
Pro. HD PNG up to 3200 px, SVG, elevation gradients.
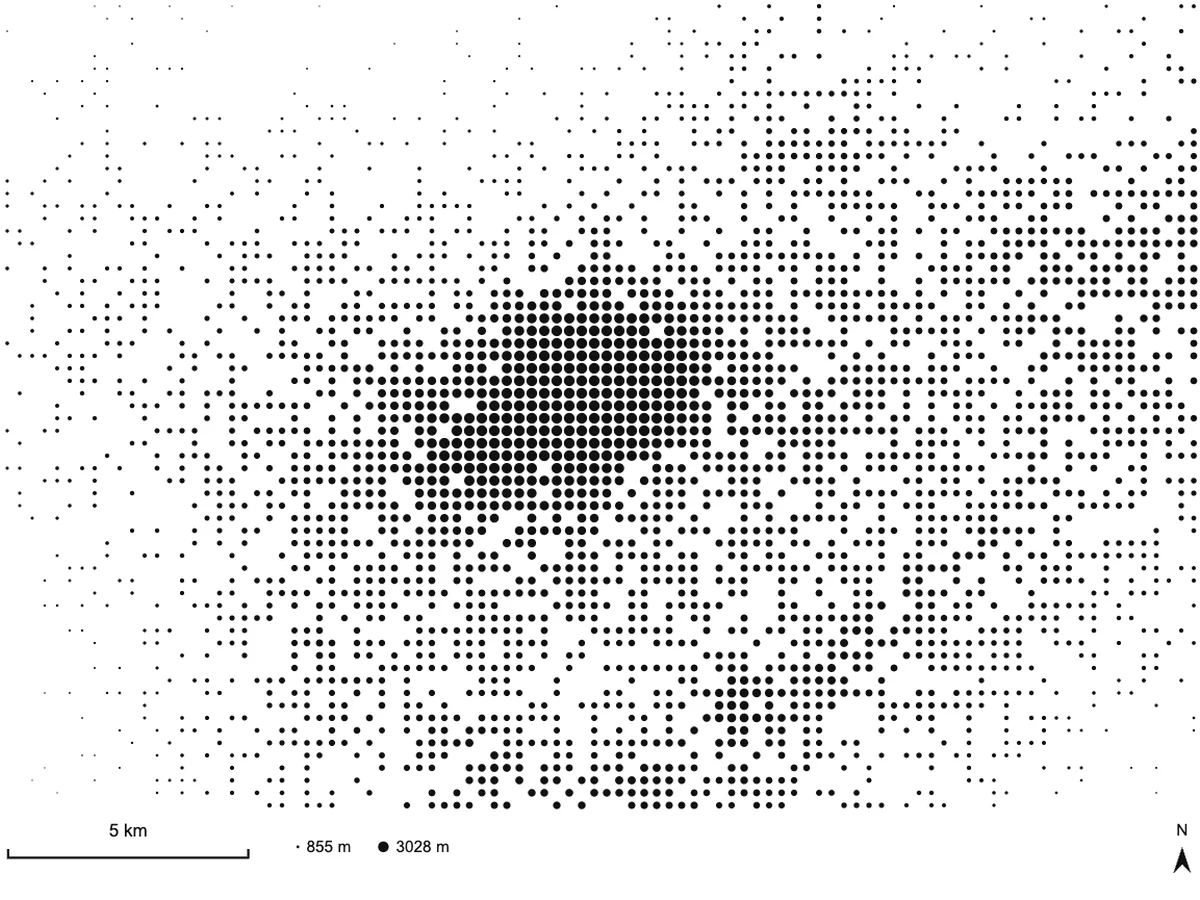
Print-ready. Scale bar, north arrow and legend on the sheet.
Everything about the Points mode, its settings and exports. See the full FAQ, or the render modes docs.
Yes, on the same terms as Lines: switching to Points, previewing it and exporting the standard PNG are free. HD PNG, SVG and elevation gradients use credits, exactly like they do for contour lines. There is no separate Points plan.
No. Both modes read the same elevation model for the same zone. Points samples it on a grid and sizes each glyph by height; Lines traces lines of equal height. Switching modes doesn't fetch the terrain again.
The size and density ramp is relative to each zone: its lowest ground gets the smallest glyphs and its highest ground the biggest. That lets a gentle coastal plain use the full range, but it also means two zones don't share one scale.
Those exports always contain the contour lines of the zone. The point field is a rendering of the elevation — export it as PNG or SVG.
Yes. Density and glyph size scale with the export width, so a PNG High or an SVG has the same pattern as the on-screen preview, just sharper.