TopoLines draws one thing: the elevation of the ground inside your zone. The Render switch at the top of the Settings panel picks how that elevation is drawn.
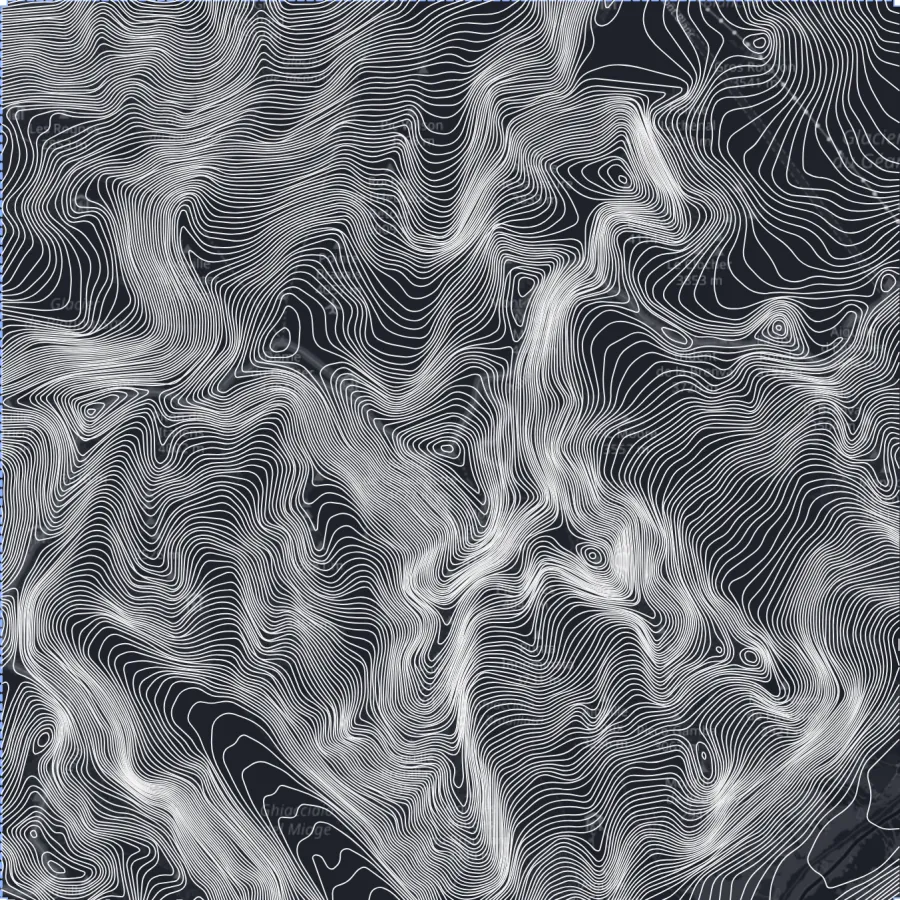
- Lines traces contour lines — every line joins points of equal height, one line per contour interval. This is the classic topographic map.
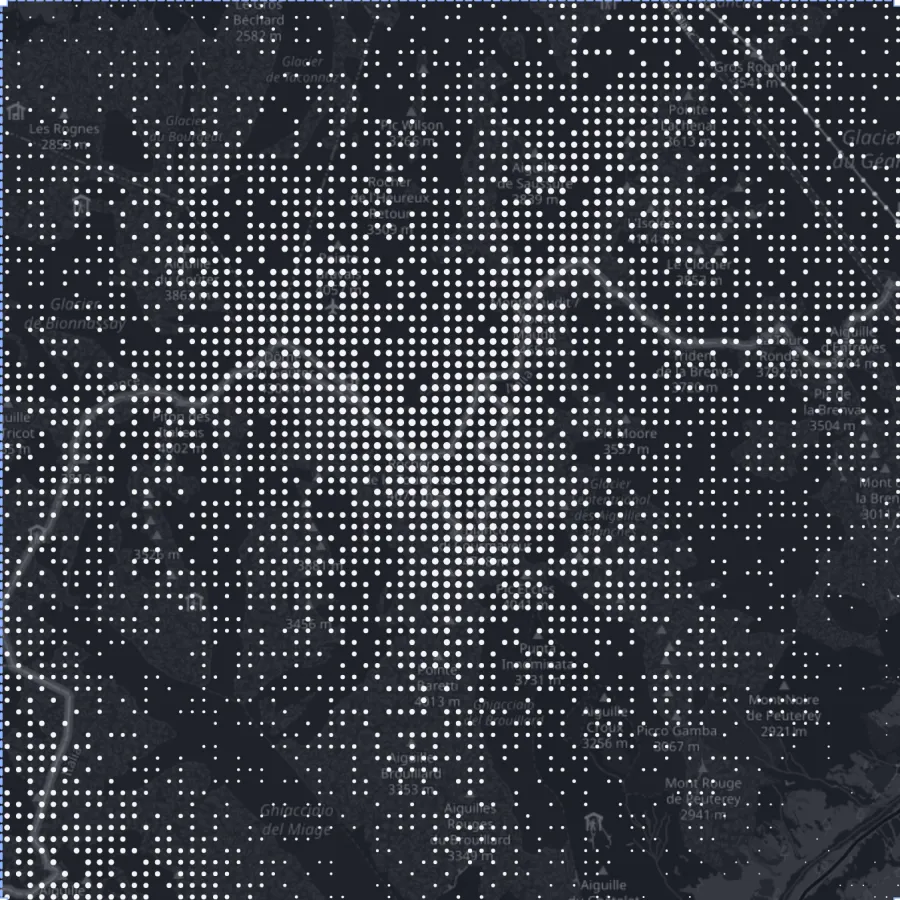
- Points draws the same terrain as a field of glyphs. Each glyph stands on the ground below it; the higher the ground, the more likely a glyph is kept and the bigger it gets.
Both modes use the same elevation model, the same zone and the same export formats. Switching between them doesn’t fetch the terrain again, so it’s instant once a zone has been generated.
Points controls
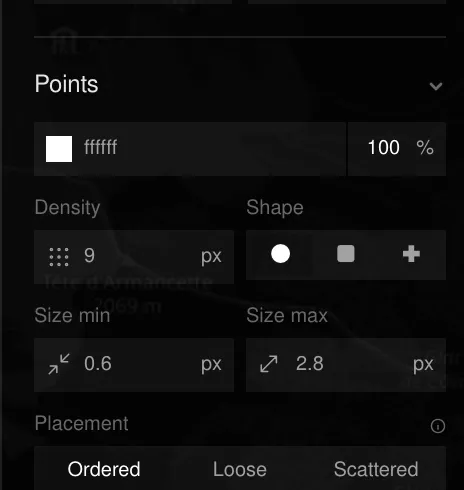
When Render is set to Points, the Stroke section becomes a Points section:
| Control | Range | Default | What it does |
|---|---|---|---|
| Density | 3–40 px | 9 px | Distance between grid nodes. Lower = more, tighter glyphs. |
| Shape | Dot · Square · Cross | Dot | The glyph drawn at each node. |
| Size min | 0.1–20 px | 0.6 px | Glyph radius on the lowest ground of the zone. |
| Size max | 0.1–20 px | 2.8 px | Glyph radius on the highest ground of the zone. |
| Placement | Ordered · Loose · Scattered | Ordered | Ordered aligns glyphs to a clean grid (a halftone). Loose and Scattered shift each glyph off its node for a hand-stippled look. |
Colour and opacity come from the same swatch as Lines. With an elevation gradient (Pro), each glyph takes the colour of its height.
How the points are placed
- When a zone is generated, TopoLines samples the elevation model on a grid of up to 220 × 220 cells and normalises it between the lowest and highest ground of that zone (the 2nd and 98th percentiles, so a single spike or pit doesn’t flatten the rest).
- A regular grid of nodes is laid over the map at the Density spacing. Each node is kept with a probability that grows with the height below it — low ground thins out, high ground fills in.
- Kept nodes get a size between Size min and Size max, again by height, and are nudged off the grid by the Placement amount.
The pattern uses a fixed random seed, so the same zone with the same settings always gives the same picture. Sea and missing data stay empty: lakes and coastlines read as blank space.
Because the ramp is relative to the zone, a valley floor in the Alps and a coastal plain can both use the full range of sizes. Two zones side by side don’t share one scale.
Live settings vs re-generate
- Shape, Size min, Size max and colour restyle the glyphs already on the map instantly (on the Pro live preview).
- Density and Placement change which glyphs exist, so they mark the zone as needing a new Generate.
Exports keep the density you see in the preview at every size: a PNG High or an SVG has the same pattern as the on-screen preview, just sharper.
What changes in Points mode
Some Lines settings have no meaning for glyphs and are hidden while Points is on: stroke width, line join, taper, relative mode, index contours and contour labels. Auxiliary contours, depression hachures and the minimum contour length only affect contour lines.
Scale bar, north arrow and legend work in both modes. In Points mode the legend shows the smallest and largest glyph with the elevations they stand for. See Cartographic options.
GeoJSON and DXF exports always contain the contour lines of the zone — the point field is a rendering, not vector data. See Exports & plans.
Last updated 28 September 2026