Almost everything open in the US comes from one programme: the USGS 3D Elevation Program (3DEP). In USGS’s words, all 3DEP products are “available, free of charge and without use restrictions”. The hard part is not access, it’s knowing which of the several 3DEP products to pick.
At a glance
| Product | Grid | Coverage | Source | Horizontal | Heights |
|---|---|---|---|---|---|
| 1 m project DEMs | 1 m | Where QL2-or-better lidar was flown | Lidar | UTM, NAD83 | NAVD88, metres (lower 48) |
| 1 m seamless (S1M) | 1 m | In production since mid-2025, growing | Lidar projects aligned to a common reference | 10 × 10 km COG tiles | See product metadata |
| 1/3 arc-second | ~10 m | Lower 48, Alaska, Hawaii, territories | Best available | Geographic, NAD83 | NAVD88 (lower 48), metres |
| 1 arc-second | ~30 m | Lower 48, Alaska, most of Canada and Mexico | Best available | Geographic, NAD83 | NAVD88 (lower 48), metres |
| 2 arc-second | ~60 m | Alaska only | Best available | Geographic | See product metadata |
| 1/9 arc-second | ~3 m | About 25% of the lower 48 | DEMs of 3 m or finer acquired before 2015 | Geographic, NAD83 | No longer updated |
| IfSAR Alaska | 5 m | Alaska | Airborne radar (QL5) | Albers | See product metadata |
Which one to pick
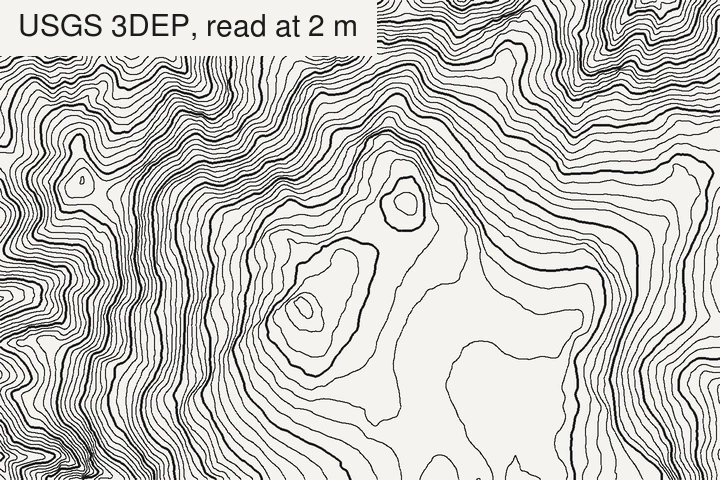
- A site, a trail, a building plot: the 1 m project DEM if your area has one. It is produced only from quality level 2 or better lidar, and it is bare earth.
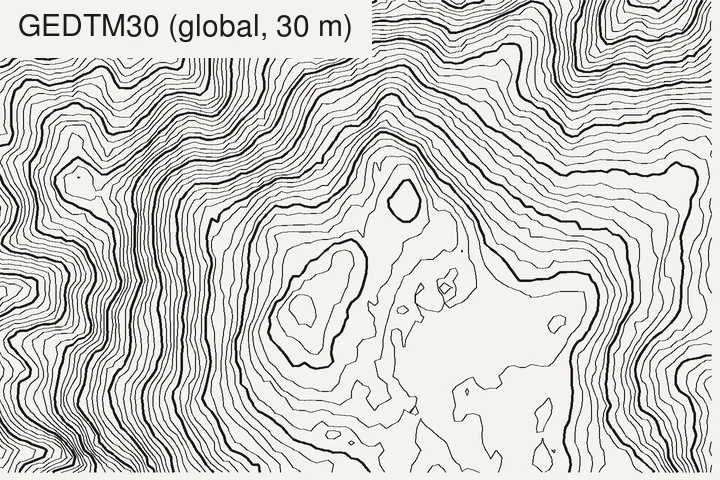
- A county, a park, a mountain range: the seamless 1/3 arc-second (~10 m). It covers the whole country, has no project seams, and is light enough for large areas.
- A state or a whole region: 1 arc-second (~30 m) is plenty for contours at that scale.
Quality levels
3DEP grades its data by quality level (QL), defined in the USGS Lidar Base Specification. The vertical accuracy is given as an RMSE:
| Quality level | Source | Vertical RMSE | Point density |
|---|---|---|---|
| QL0 | Lidar | 5 cm | ≥ 8 pts/m² |
| QL1 | Lidar | 10 cm | ≥ 8 pts/m² |
| QL2 | Lidar | 10 cm | ≥ 2 pts/m² |
| QL3 | Lidar | 20 cm | ≥ 0.5 pts/m² |
| QL5 | IfSAR (radar) | 185 cm | n/a |
QL2 is the minimum for new 3DEP lidar. With the classic rule of about 3.3 × the RMSE, QL2 data supports contours down to about 0.5 m on open ground, and Alaska’s IfSAR about 6 m.
Traps specific to the US
- Project seams. The 1 m project DEMs are seamless within a lidar project, not across projects. Where two projects meet, flown years apart, contours can jump by a few decimetres. Check the project boundaries in the downloader before you mosaic, or use the new seamless S1M tiles where they exist.
- Not all lidar is equal. USGS says most data collected in 2014 and later meets the QL2 specifications for pulse spacing and vertical accuracy; older collections often don’t. The 1/3 arc-second DEM blends sources of different ages, so its quality varies from one county to the next.
- Feet and metres. The standard 3DEP DEMs are in metres. Raw lidar and many state or county deliveries are in feet with State Plane coordinates. Contouring a feet raster with a “10” interval gives 10 ft lines, not 10 m: always check the units first. Older data may also use the US survey foot, which NIST and NGS deprecated on 1 January 2023 in favour of the international foot. The difference is only 2 parts per million, but over State Plane coordinates of millions of feet it adds up to a metre or more horizontally.
- NAVD88 is being replaced. The National Geodetic Survey is replacing NAVD88 with a gravity-based geopotential datum. NGS says NAVD88 is biased by about half a metre and tilted by about 1 m from coast to coast, so published heights will change by decimetres to around a metre depending on the region. Keep the datum in your metadata so old and new data don’t get silently mixed.
- Alaska is different. Outside the lidar-covered areas, the best statewide model is the 5 m IfSAR, radar-based, with an RMSE of 1.85 m, which behaves more like a surface model under dense vegetation.
Where to download
- The National Map Downloader: pick Elevation Products (3DEP), draw your area, and download tiles. Best for a few tiles.
- OpenTopography: serves the standard 3DEP DEMs and the lidar point clouds, clipped to your area. Best when you want one file for an arbitrary box, or the points themselves.
- Bulk and scripted access: USGS publishes GDAL VRTs for the seamless DEMs (for example
USGS_Seamless_DEM_13.vrtin itsprd-tnmS3 bucket), sogdal_translatecan cut your area straight from the national mosaic without downloading tiles one by one. - Alaska IfSAR: EarthExplorer, under Digital Elevation.
What TopoLines uses in the US
The free tier traces from GEDTM30 (30 m). HD exports read 3DEP, at up to 1 m where lidar was flown. The source of your zone is shown in Map info and credited in every export. Full list in the datasets docs.
References
- U.S. Geological Survey (2026). About 3DEP products & services. 3D Elevation Program.
- U.S. Geological Survey (2026). Topographic data quality levels (QLs). 3D Elevation Program.
- NOAA National Geodetic Survey (2026). New datums. Modernized National Spatial Reference System.
- National Institute of Standards and Technology (2020). U.S. survey foot. NIST Physical Measurement Laboratory.
Last updated 5 November 2026