Most elevation mistakes don’t crash anything. They produce a map that looks perfectly reasonable and is wrong. These ten are the ones that come up again and again on GIS forums, each with the symptom to look for and the check that catches it.
1. Contouring a surface model
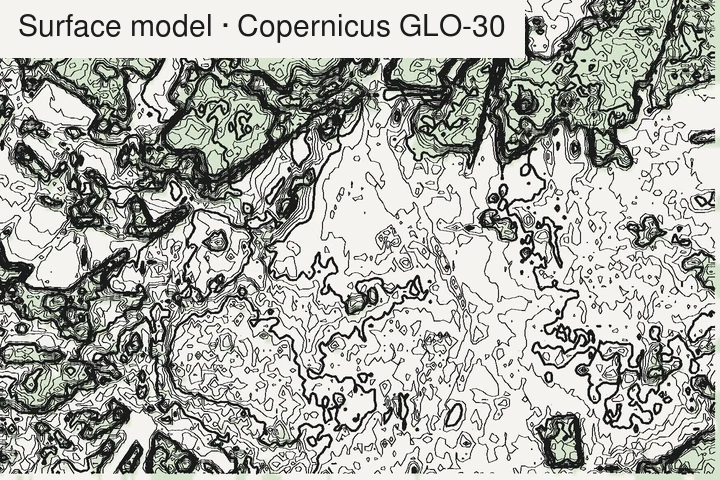
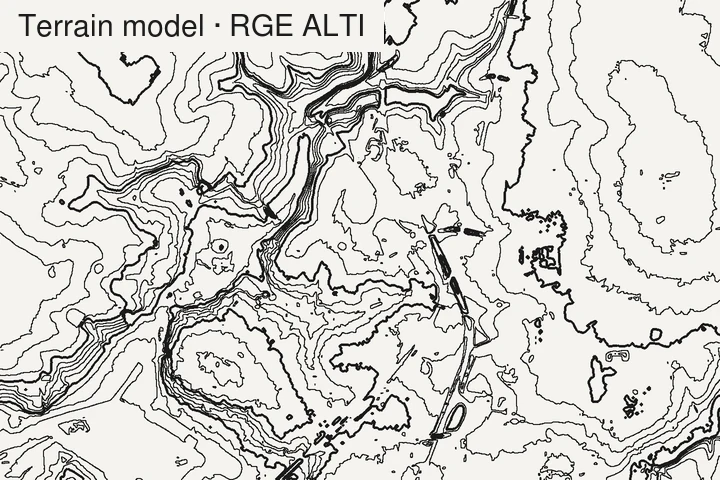
Symptom: contours wiggle around every wood, draw rectangles in towns, and a forested ridge comes out several metres, sometimes tens of metres, higher than the map says.
Why: the dataset is a DSM (surface: tree tops, roofs), not a DTM (bare ground); the terms are defined in Guth et al. (2021). Copernicus GLO-30, SRTM and NASADEM, ALOS AW3D30, ArcticDEM and REMA are all surface models.
Check: look up the product type before downloading. On a forest edge, a surface model shows a step the height of the trees. See which global models are bare earth.
2. Feet read as metres (or the reverse)
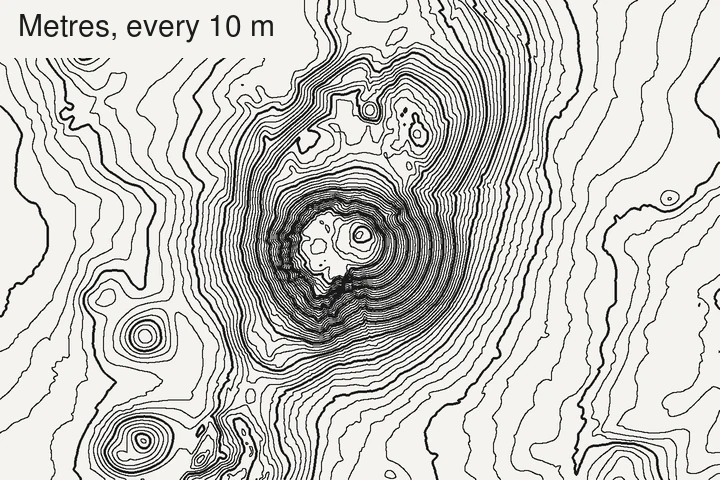
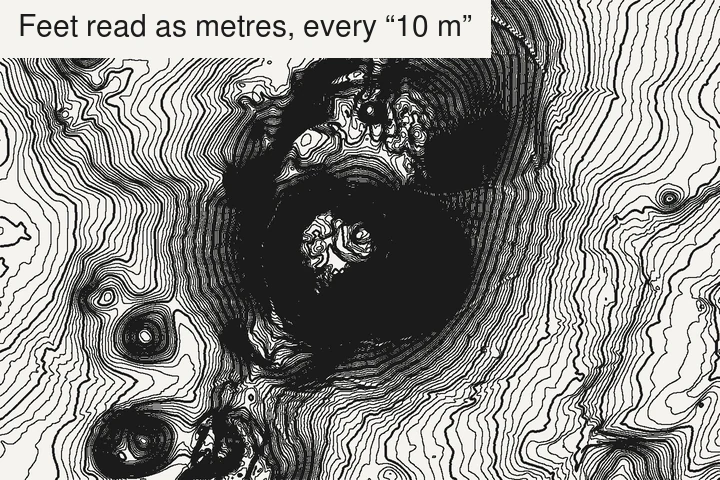
Symptom: a “10 m” interval gives three times too many lines, or a mountain stands at 4,000 m when it should be 1,200.
Why: a lot of US lidar and state data is in US survey feet. Nothing in the pixel values says so.
Check: read the vertical unit in the metadata (gdalinfo shows it if the file declares
it). Then sanity-check one known point, such as a summit, against a map.
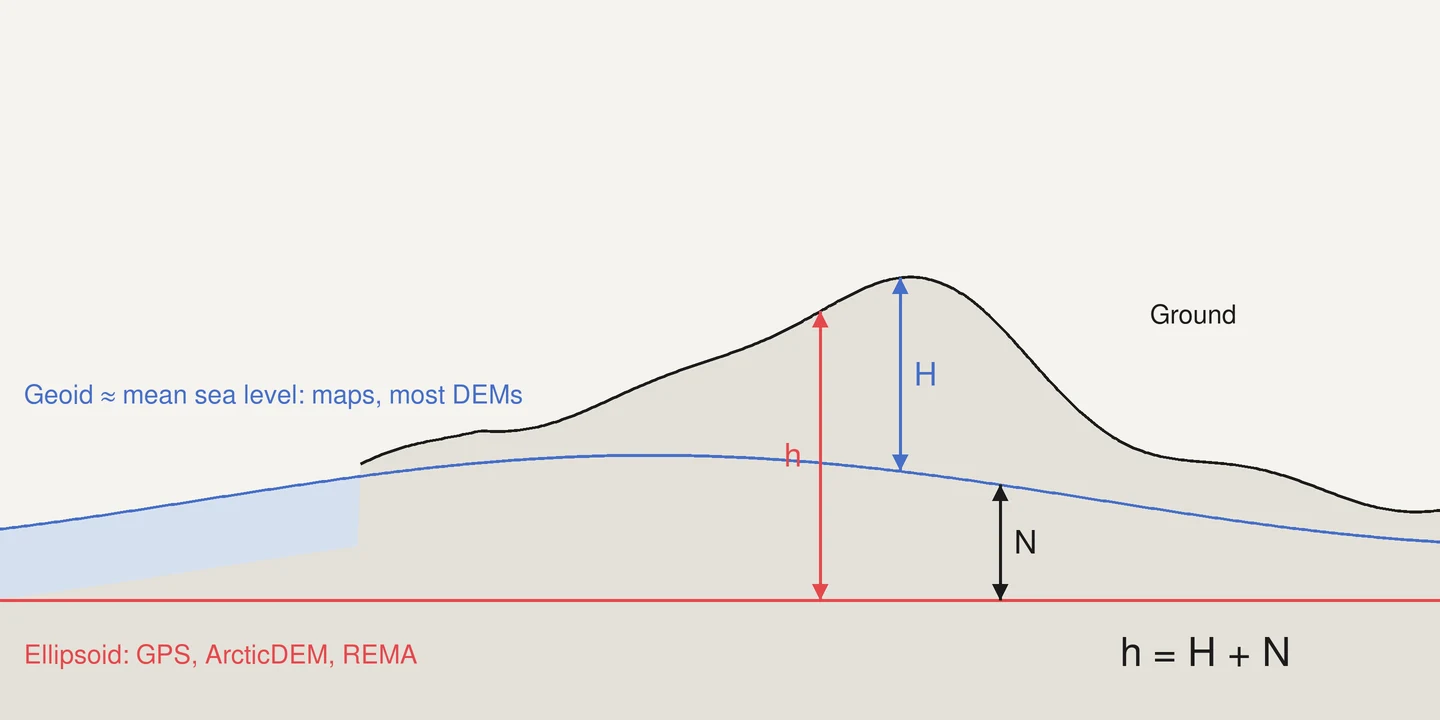
3. Mixing geoid and ellipsoid heights
Symptom: your GPS track floats above the terrain, or sinks into it, by a constant tens of metres. Coastal pixels show negative heights.
Why: GPS and some datasets (ArcticDEM, REMA) give heights above the ellipsoid; maps and most DEMs give heights above the geoid (roughly, mean sea level). The gap, the geoid height, ranges from about −107 m (in the Indian Ocean, south of India) to about +86 m (New Guinea) in the EGM2008 model (Pavlis et al., 2012); across mainland France it’s between about 42 and 56 m.
Check: confirm the vertical CRS of every layer, and convert with a geoid grid (PROJ and QGIS handle it when the vertical CRS is set) before comparing.
4. Contouring in degrees
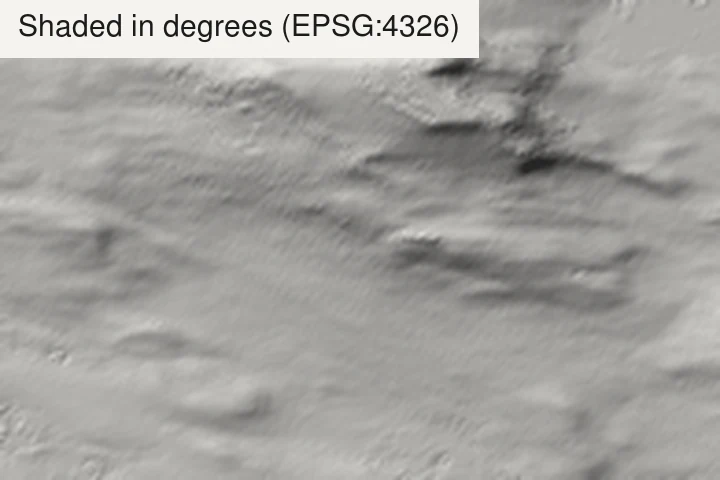
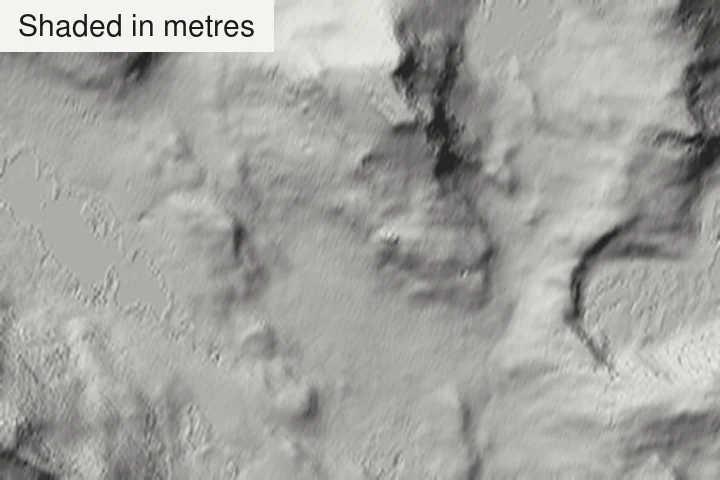
Symptom: smoothing and minimum-length settings behave differently north–south and east–west; slope and hillshade look stretched.
Why: the raster is in geographic coordinates (EPSG:4326), where one degree of longitude shrinks with latitude.
Check: reproject to a metric projection (UTM, or the national one: Lambert-93, British National Grid…) before contouring, slopes or hillshades.
5. Hidden vertical exaggeration
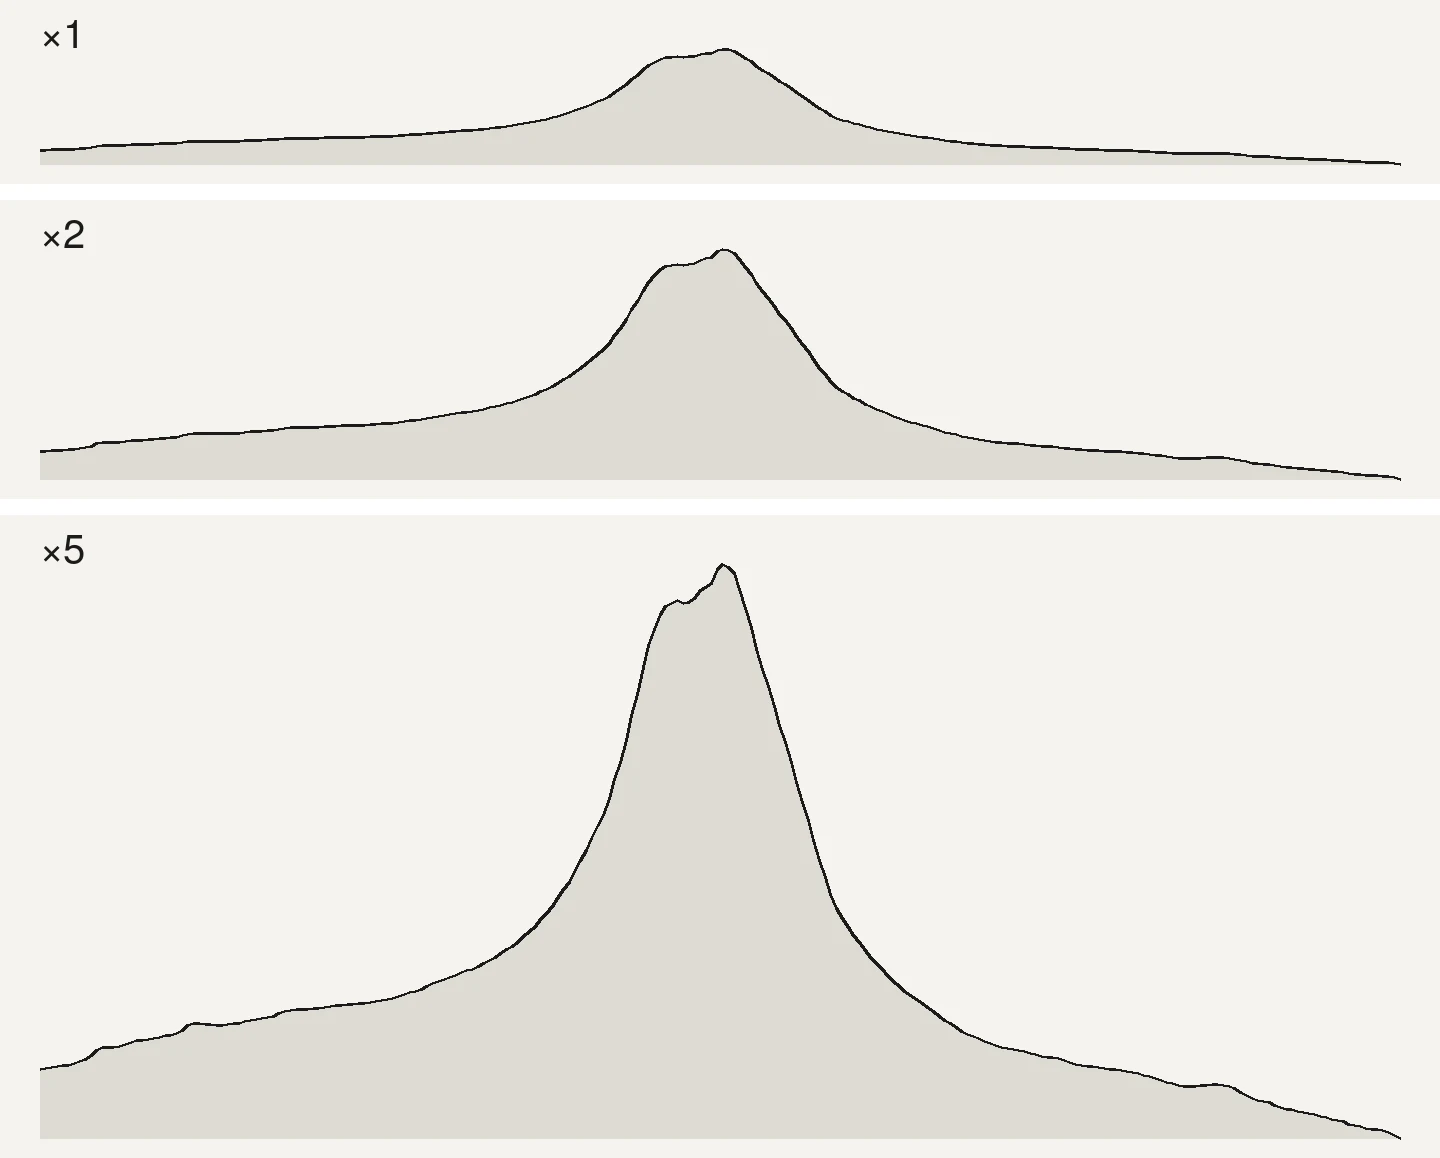
Symptom: a 3D render or a terrain profile makes rolling hills look like the Himalaya, and nobody can tell by how much.
Why: exaggeration is often set to make a render “read”, then never mentioned.
Check: state the factor next to the image (×1, ×2…). For profiles, give both axes the same units and say the ratio.
6. Tile seams and NoData edges
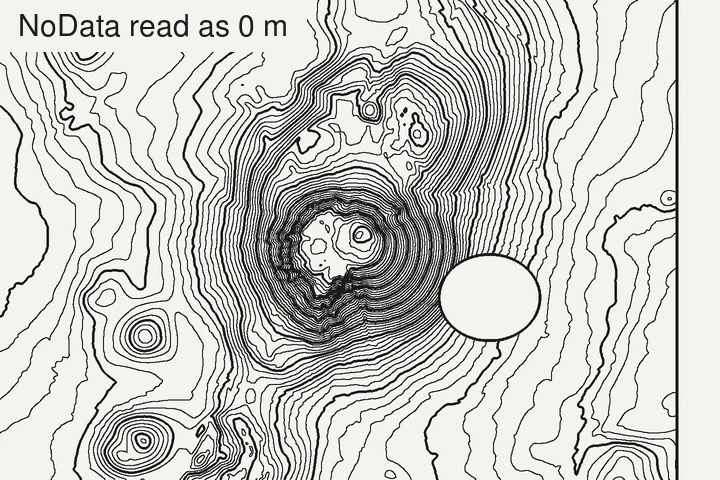
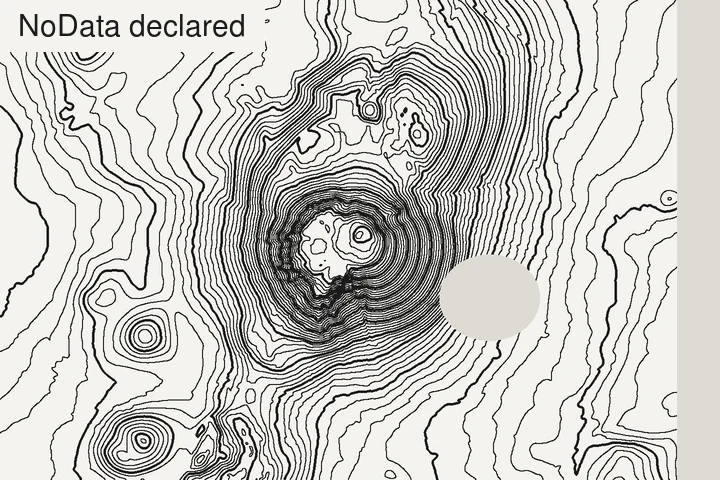
Symptom: straight lines in the contours along a grid, cliffs at tile boundaries, or contour rings around holes.
Why: tiles from different flights or years don’t match exactly, and NoData cells at the edges get read as 0 m or as a wall.
Check: mosaic first (a VRT is enough), make sure NoData is declared, and fill small voids before contouring.
7. Resampling with nearest neighbour
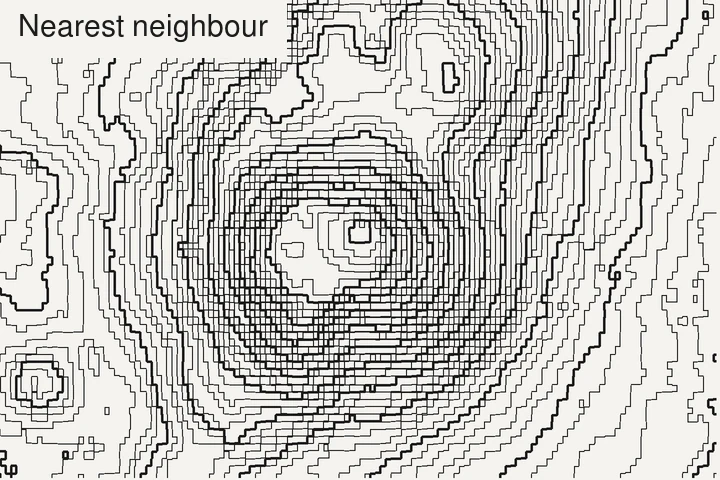
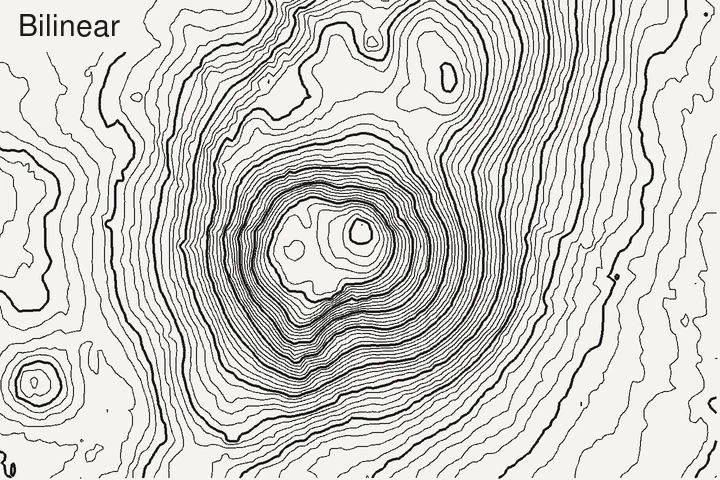
Symptom: staircase contours, small terraces on smooth slopes.
Why: reprojecting or resizing an elevation raster with nearest neighbour copies cells in blocks.
Check: use bilinear or cubic resampling for continuous data like elevation. Keep nearest neighbour for categories (land cover).
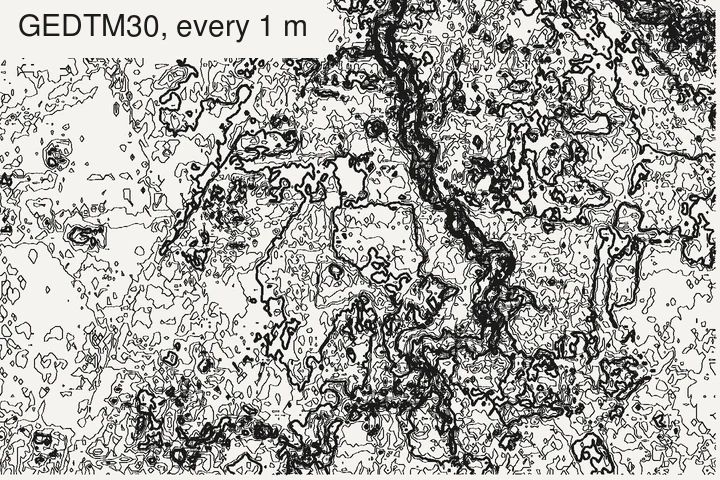
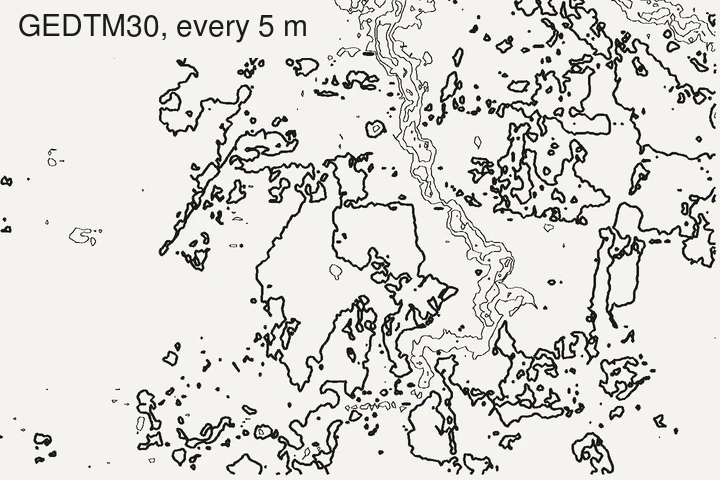
8. An interval finer than the data
Symptom: a maze of tiny closed loops on flat ground.
Why: the interval is smaller than the data’s vertical noise, so the contours trace the noise.
Check: keep the interval at about 3.3 times the data’s vertical RMSE, the equivalent of the 1947 National Map Accuracy Standards rule (90% of heights within half an interval). On flat, low-lying ground, global 30 m models are at their weakest (Guth et al., 2024): use lidar or a larger interval. How to choose an interval.
9. Trusting the grid size as the level of detail
Symptom: a 1 m DEM that still looks smooth, or misses a 3 m wide ditch.
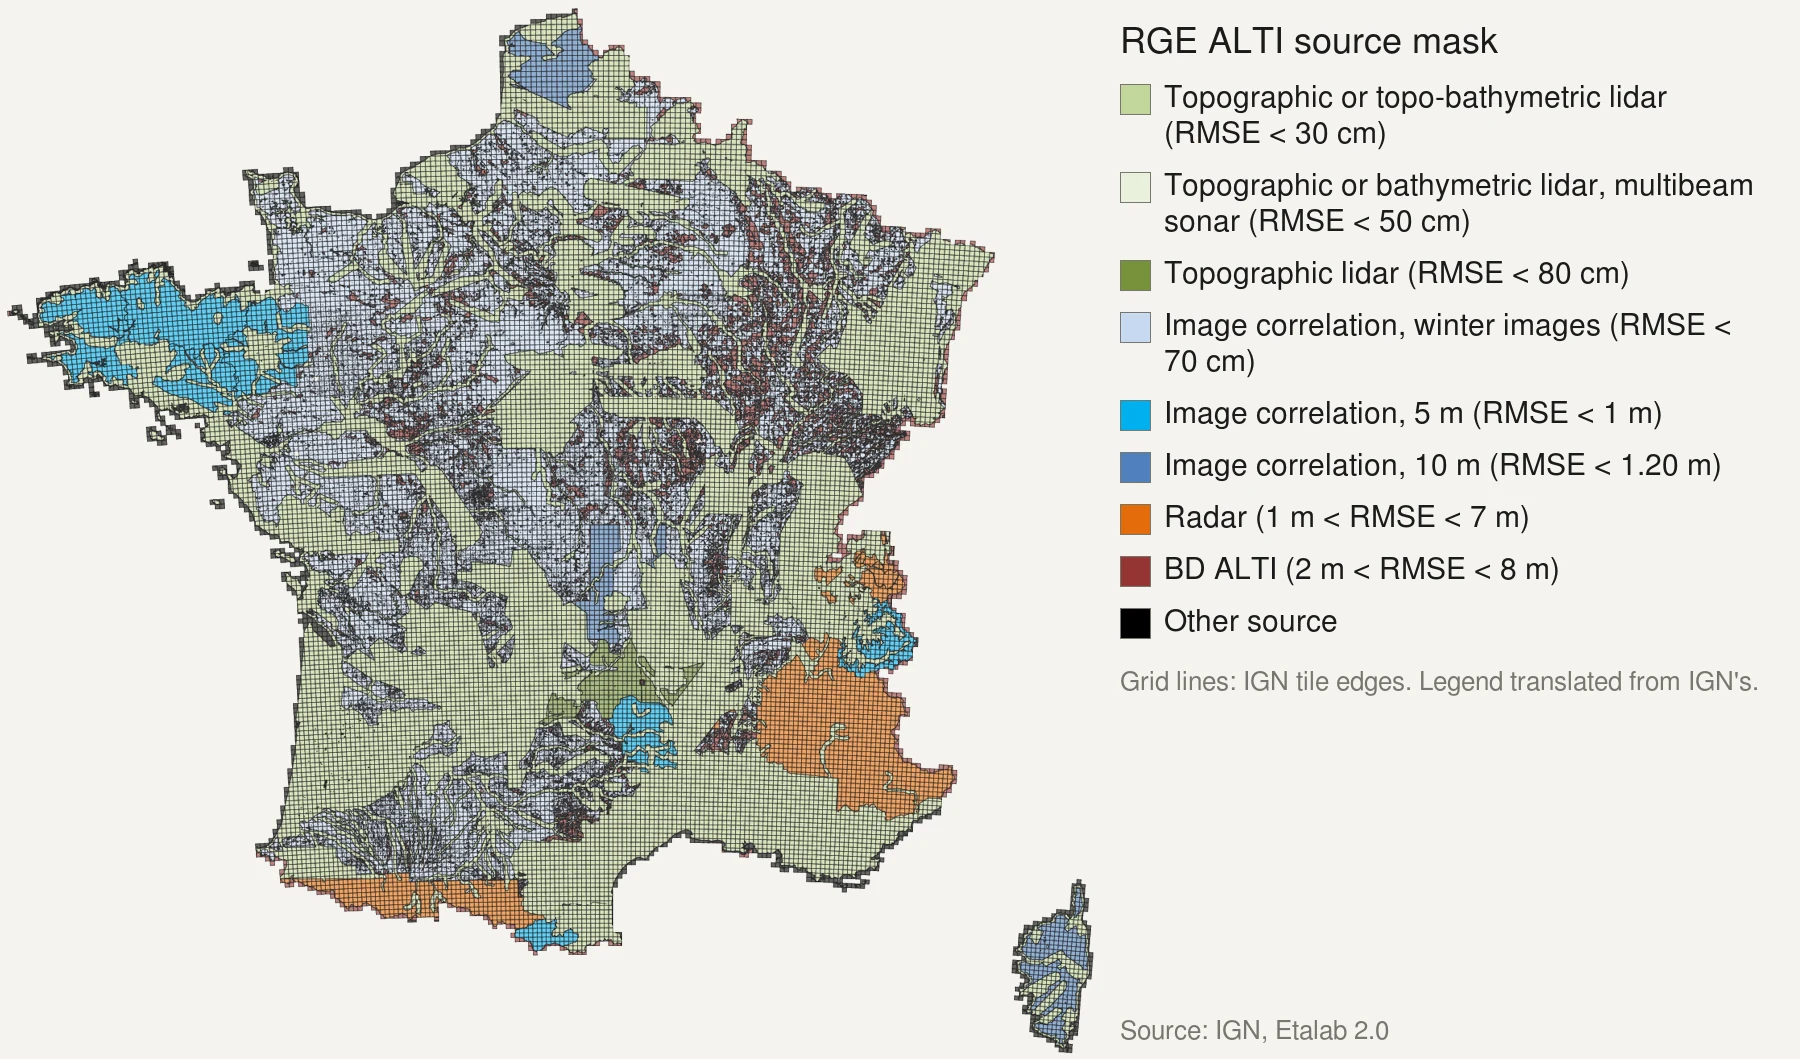
Why: a grid can be resampled from coarser sources. France’s RGE ALTI is a 1 m grid across the country, but built from radar in the high Alps and the Pyrenees, with errors around 7 m on steep slopes; global 30 m models are often smoother than 30 m.
Check: read which source covers your area, not just the pixel size. France’s patchwork, explained.
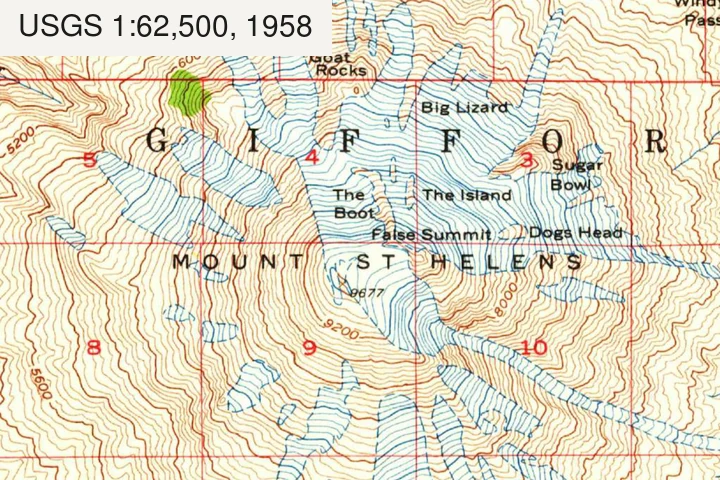
10. Old data presented as current
Symptom: a quarry, a new road or a landslide is missing, or a filled-in pit is still there.
Why: SRTM is from 2000, Copernicus from 2011–2015, and national lidar from the year it was flown.
Check: put the acquisition date of the data in the map’s credits, next to the source.
References
- Guth, P. L., Van Niekerk, A., Grohmann, C. H., Muller, J.-P., Hawker, L., Florinsky, I. V., Gesch, D., Reuter, H. I. et al. (2021). Digital elevation models: terminology and definitions. Remote Sensing 13(18), 3581. doi:10.3390/rs13183581
- Pavlis, N. K., Holmes, S. A., Kenyon, S. C. & Factor, J. K. (2012). The development and evaluation of the Earth Gravitational Model 2008 (EGM2008). Journal of Geophysical Research: Solid Earth 117(B4). doi:10.1029/2011JB008916
- Guth, P. L., Trevisani, S., Grohmann, C. H., Lindsay, J., Gesch, D., Hawker, L. & Bielski, C. (2024). Ranking of 10 global one-arc-second DEMs reveals limitations in terrain morphology representation. Remote Sensing 16(17), 3273. doi:10.3390/rs16173273
- U.S. Bureau of the Budget (1947). United States National Map Accuracy Standards. reproduced in USGS, Map Accuracy (National Mapping Program fact sheet).
Last updated 5 November 2026