Colorado elevation map
in contour lines
A topographic map of the whole state, drawn as contour lines every 100 m and coloured by height, from the Eastern Plains to the Continental Divide.
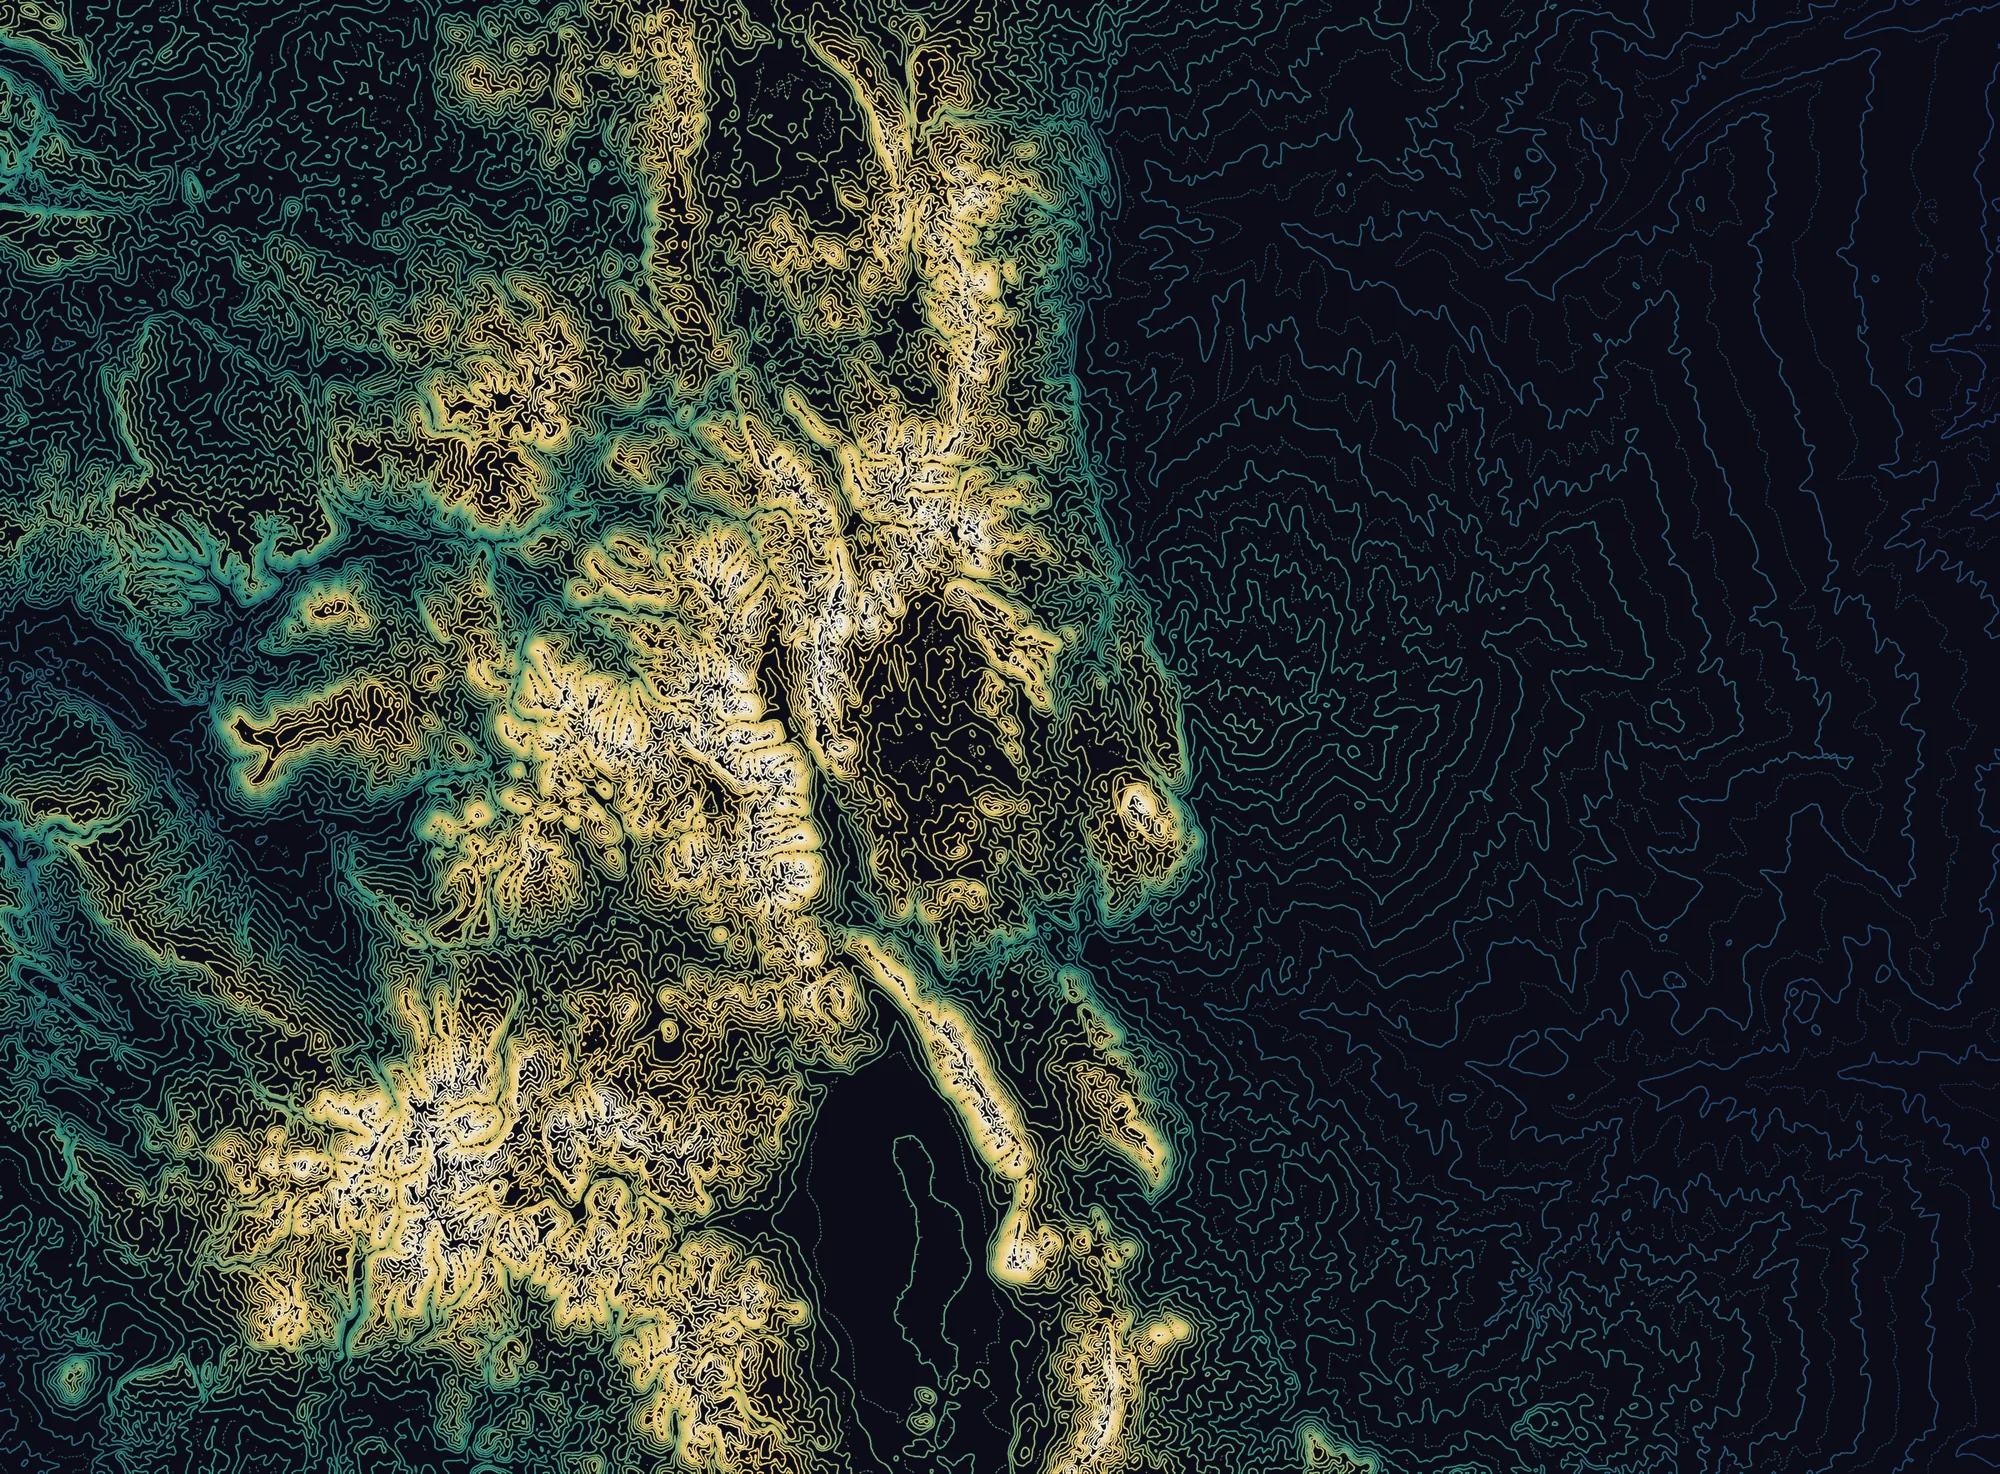
Colorado is the highest state in the US on average, and the only one that lies entirely above 1,000 m. Its lowest point, on the Kansas line, is higher than the highest point of 18 other states.
Read the map from right to left and the state climbs in three steps: the plains, the wall of the Front Range, then the ranges strung along the Continental Divide. West of the Divide the land drops again in mesas and canyons toward Utah.
How much of Colorado is high ground
Share of the state above each height, measured on the same elevation data as the map:
- Above 1,500 m (4,900 ft) 74 %
- Above 2,000 m (6,560 ft) 50 %
- Above 2,500 m (8,200 ft) 29 %
- Above 3,000 m (9,840 ft) 12 %
- Above 3,500 m (11,480 ft) 3 %
Half the state stands above 2,000 m. Above 3,500 m only the summit ridges remain: about 3 % of Colorado, which is still close to 8,000 km².
The regions
on the map
Six landscapes you can pick out from the spacing of the lines alone.
Eastern Plains
The eastern two-fifths of the state is high plain, tilted gently toward Kansas. It climbs from the Arikaree River at 1,011 m, the highest low point of any US state, to about 1,800 m at the foot of the mountains. On the map it is the wide field of loose, evenly spaced blue lines: little relief, so few contours.
Front Range
The first wall of the Rockies rises abruptly out of the plains west of Denver, Boulder and Colorado Springs. Pikes Peak (4,302 m, 14,115 ft) stands about 2,460 m above downtown Colorado Springs, and the contours bunch tight on its eastern face.
Sawatch Range and the Continental Divide
The Divide runs down the middle of the state. The Sawatch Range carries its highest summits: Mount Elbert (4,401 m) and Mount Massive (4,398 m), the two highest peaks in the Rockies. Leadville sits at their foot at 3,094 m.
San Luis Valley
The dark, almost empty shape in the south is a high basin, roughly 2,300 m (7,500 ft) on its floor, between the San Juans and the Sangre de Cristo. It is so flat that at 100 m spacing almost no contour crosses it, and the Great Sand Dunes pile up against its eastern edge.
San Juan Mountains
The largest range in Colorado by area fills the south-west corner with a dense knot of summits, Uncompahgre Peak (4,361 m, 14,309 ft) the highest. It shows as the broad bright mass in the lower left of the map.
Western Slope and the Colorado Plateau
West of the mountains the land steps down to mesas and canyons. Grand Junction lies at about 1,397 m (4,583 ft), and the Grand Mesa, one of the largest flat-topped mountains in the world, holds its plateau above 3,000 m.
Up close
at 30 m
The state map is averaged to fit on one screen. Zoom in and the same data resolves every ridge and gully. Both close-ups are drawn with 50 m contours.
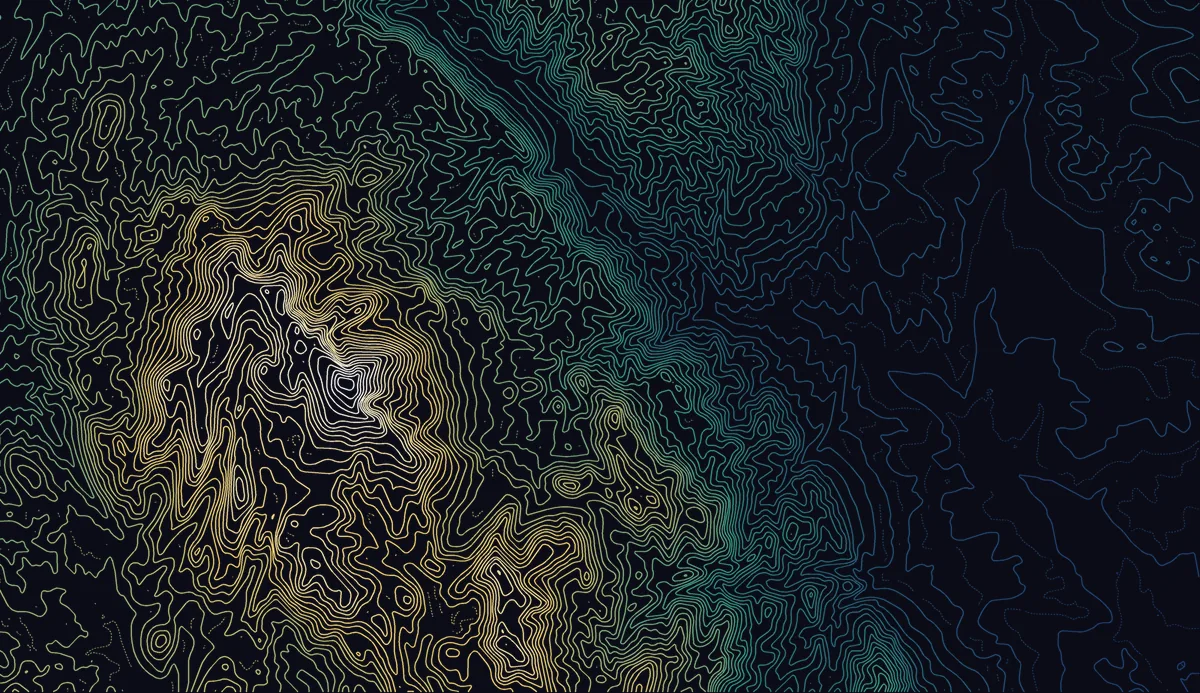
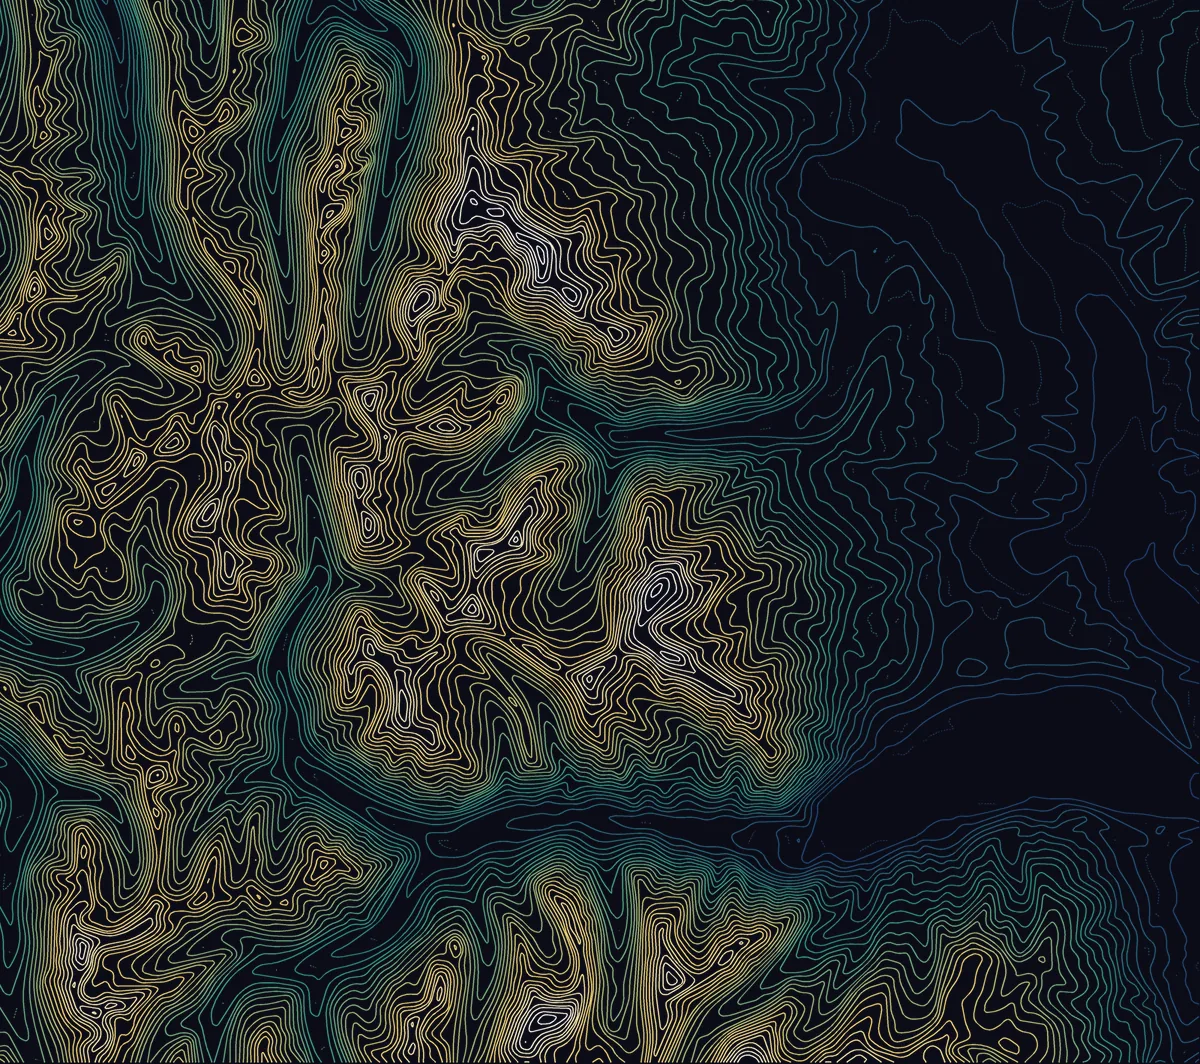
The elevation comes from GEDTM30, a global bare-earth terrain model at 30 m built by Yu-Feng Ho, Tom Hengl and colleagues at OpenGeoHub (PeerJ, 2025). Bare-earth means trees and buildings are removed, so the lines follow the ground itself.
For the state map, the 30 m grid is averaged to cells of about 330 m, then traced into contour lines every 100 m with the same engine as the contour map generator. Averaging trims the very tops of the peaks, so the highest cell reads 4,338 m rather than Mount Elbert's surveyed 4,401 m: the named heights on this page are the official USGS figures.
The colour is a hypsometric ramp: it assigns each line a colour by its height, which is how relief maps have shown altitude for over a century. New to contour lines? Start with what is a contour map, or read about choosing a contour interval.
Frequently asked questions
Heights, records and the data behind the map. To read the lines themselves, see how to read a contour map.
What is the average elevation of Colorado?
About 2,070 m (6,800 ft), the highest mean elevation of any US state according to the USGS. Averaging the GEDTM30 terrain model over the state gives 2,089 m, and half of Colorado lies above 2,000 m.
What is the highest point in Colorado?
Mount Elbert, at 4,401 m (14,440 ft), in the Sawatch Range near Leadville. It is the highest summit of the Rocky Mountains and the second-highest peak in the contiguous United States after Mount Whitney.
What is the lowest point in Colorado?
The Arikaree River where it leaves the state for Kansas, at 1,011 m (3,317 ft). It is the highest low point of any US state: all of Colorado lies above 1,000 m.
What is the highest city in Colorado?
Leadville, at 3,094 m (10,152 ft), the highest incorporated city in the United States. Denver sits at 1,609 m: one step of the State Capitol is marked at exactly 5,280 ft, one mile.
How many fourteeners are there in Colorado?
58 named peaks rise above 14,000 ft (4,267 m), 53 of them ranked as separate summits. That is more than any other state in the contiguous US. Most are in the Sawatch, the San Juans, the Elk Mountains, the Mosquito Range and the Front Range.
How do I read this elevation map?
Each line joins points of equal height, every 100 m. Lines close together mean steep ground, lines far apart mean flat ground. The colour follows the height: deep blue on the plains, green and gold in the foothills, white on the highest summits. For more, see how to read a contour map.
Can I make a contour map of one part of Colorado?
Yes. Open the TopoLines editor on any trailhead, peak or town, choose the contour interval, and export a PNG for free. Paid exports add vector SVG, DXF and finer US elevation data from USGS 3DEP, down to 1 m lidar where it has been flown.
Where does the elevation data come from?
From GEDTM30, an open global bare-earth terrain model at 30 m by OpenGeoHub. The state map averages it to about 330 m cells so the whole of Colorado fits in one image; the close-ups use the full 30 m grid.