
The contour interval is the difference in elevation between two neighbouring contour lines on a map. It’s the same everywhere on the sheet and printed in the legend: “contour interval 20 feet” means that each line is 20 ft higher or lower than the next one. To calculate it yourself, take two labelled index contours, subtract their elevations, and divide by the number of spaces between them.
This guide covers where to find the interval, how to work it out when it isn’t printed, what index contours are, and how to use the interval to read heights and slopes. New to contour maps? Start with what a contour map is.
Contour interval definition
A contour line joins points of equal elevation. The contour interval is the fixed vertical step between one line and the next: 10 ft, 20 ft, 40 ft on US topographic maps, or 5 m, 10 m, 20 m on metric maps.
Two things follow from it:
- Crossing one line means climbing or descending exactly one interval. If the interval is 20 ft and you cross five lines uphill, you’ve climbed 100 ft, whatever the horizontal distance.
- The interval is vertical, not horizontal. The distance between the lines on the paper changes all the time: lines close together mean steep ground, lines far apart mean gentle ground. The height step between them never changes.
Don’t confuse the contour interval with the map scale. The scale (1:24,000, 1:25,000…) converts distances on the map into distances on the ground; the interval converts lines into heights.
Index contours and intermediate contours
On most topographic maps, the lines don’t all look the same:
- Index contours are drawn thicker and labelled with their elevation. On USGS maps and most national maps, every fifth line is an index contour. With a 20 ft interval, index contours fall every 100 ft (500, 600, 700…); with a 10 m interval, every 50 m.
- Intermediate contours are the thinner, unlabelled lines between them. Their height comes from counting up or down from the nearest index contour.
- Supplementary contours, drawn dashed at half the interval, appear only on flat ground where the regular lines are too far apart to show the shape.
Index contours exist so you never have to count from sea level: they are the numbered reference lines, and the interval fills in the rest.
How to find the contour interval on a map
- Look in the legend. Printed maps state it in the margin, usually under the scale bar: “CONTOUR INTERVAL 40 FEET” on a USGS quadrangle, or “Equidistance 10 m” on many European maps.
- Check the unit. Feet and metres are easy to mix up, and the same number means very different terrain: a 10 m interval is about 33 ft.
- If it isn’t printed, calculate it from the index contours, as below. This is what school worksheets and map-reading exams ask for.
How to calculate the contour interval
Contour interval = (elevation difference between two index contours) ÷ (number of spaces between them)
- Find two neighbouring index contours with their labels, for example 500 ft and 600 ft. The difference is 100 ft.
- Count the spaces between those two lines, not the lines. With four thin lines between the two index contours, there are five spaces.
- Divide: 100 ft ÷ 5 = 20 ft.
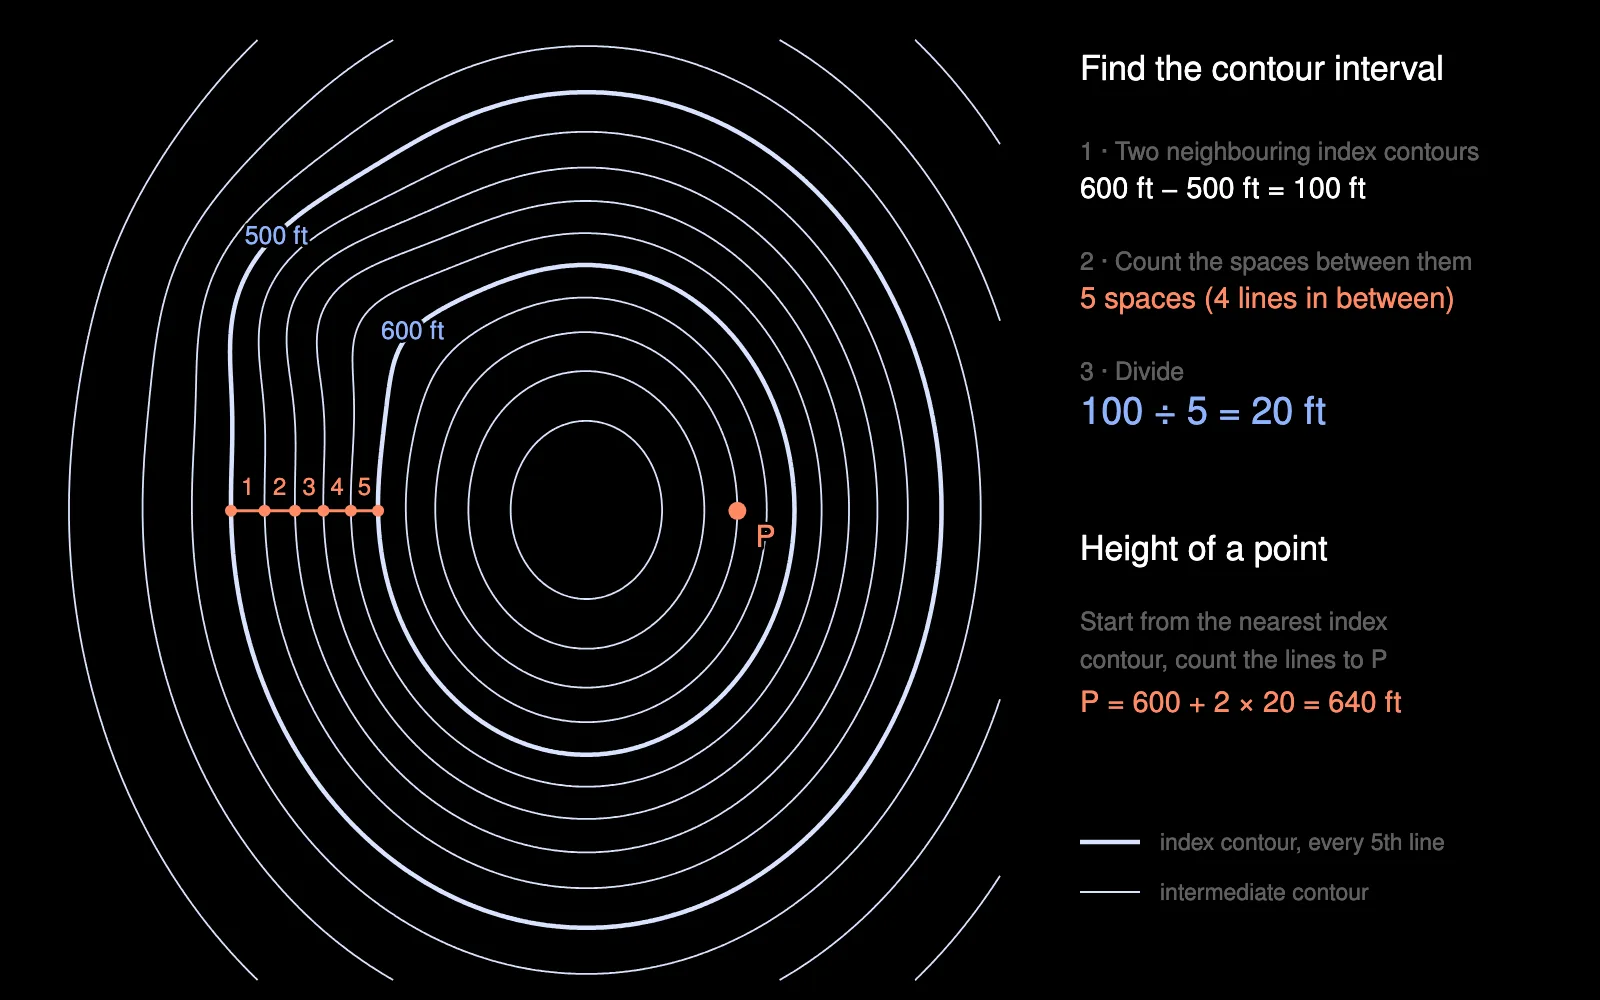
The classic mistake is dividing by the number of lines in between (4), which gives 25 ft instead of 20 ft. A quick check: the interval is almost always a round number (1, 2, 5, 10, 20, 25, 40, 50, 100). If you get 33.3, recount.
Another example, in metres: two index contours read 1,200 m and 1,300 m, with four lines between them. 100 m ÷ 5 = 20 m.
No index labels nearby? Use any two lines whose elevation you know, such as a spot height sitting exactly on a contour, or a summit and the highest labelled line, and apply the same formula: height difference ÷ number of spaces.
How to determine the interval between index contours
The interval between index contours (the “index interval”) is the contour interval multiplied by the number of spaces between two index lines, usually five. A 20 ft interval gives index contours every 100 ft; a 40 ft interval, every 200 ft; a 10 m interval, every 50 m. If you can read two neighbouring index labels, their difference is the index interval.
Using the contour interval
Elevation of a point
Start from the nearest index contour and count the lines to your point, adding one interval per line uphill (or subtracting downhill). In the diagram above, P is two lines above the 600 ft contour: 600 + 2 × 20 = 640 ft.
A point between two lines lies between their two elevations. To estimate it, interpolate: a point a third of the way from the 640 ft line to the 660 ft line is at about 647 ft. Inside the smallest closed loop of a summit, the top is higher than that loop but less than one interval higher, unless a spot height gives the exact value.
Elevation difference and slope
The number of lines crossed between two points × the interval = the height difference. Divide by the horizontal distance (measured with the map scale) and you have the slope:
- Three lines crossed with a 20 ft interval = 60 ft of climb.
- Over 300 ft of horizontal distance, that’s 60 ÷ 300 = 20 % (about 11°).
The same interval on denser lines means a steeper slope, which is why spacing reads as steepness. More on reading landforms in how to read contour lines.
Common contour intervals
There is no single standard: each map picks the interval that suits its scale and terrain. Some references:
- USGS 1:24,000 topographic maps range from 5 or 10 ft on flat ground to 40 ft and more in mountains, chosen sheet by sheet.
- USGS 1:100,000 metric maps use 5, 10, 20 or 50 m depending on relief.
- European 1:25,000 hiking maps mostly sit between 5 and 20 m.
- 1:50,000 national maps such as the Survey of India toposheets and South Africa’s 1:50,000 topographic series use a 20 m interval.
The same terrain with a small and a large interval:
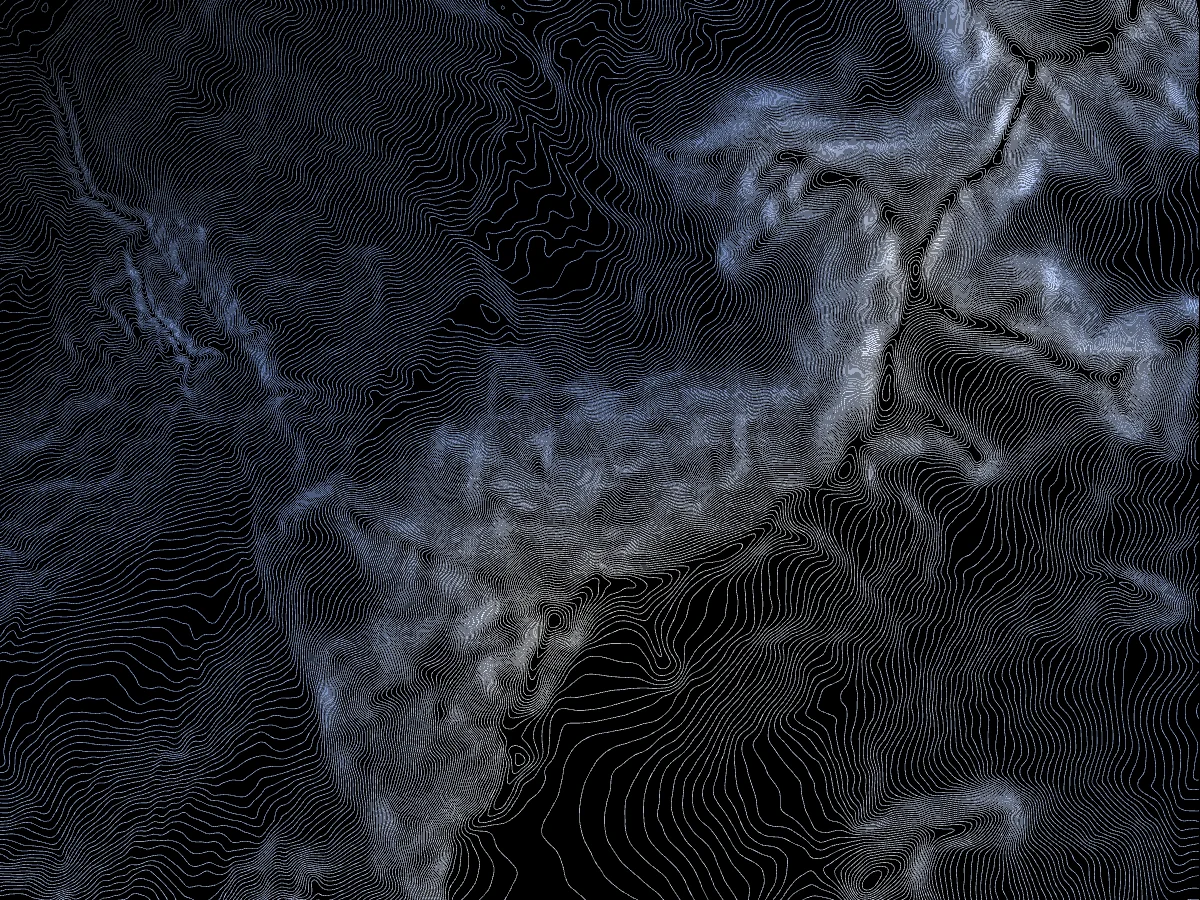
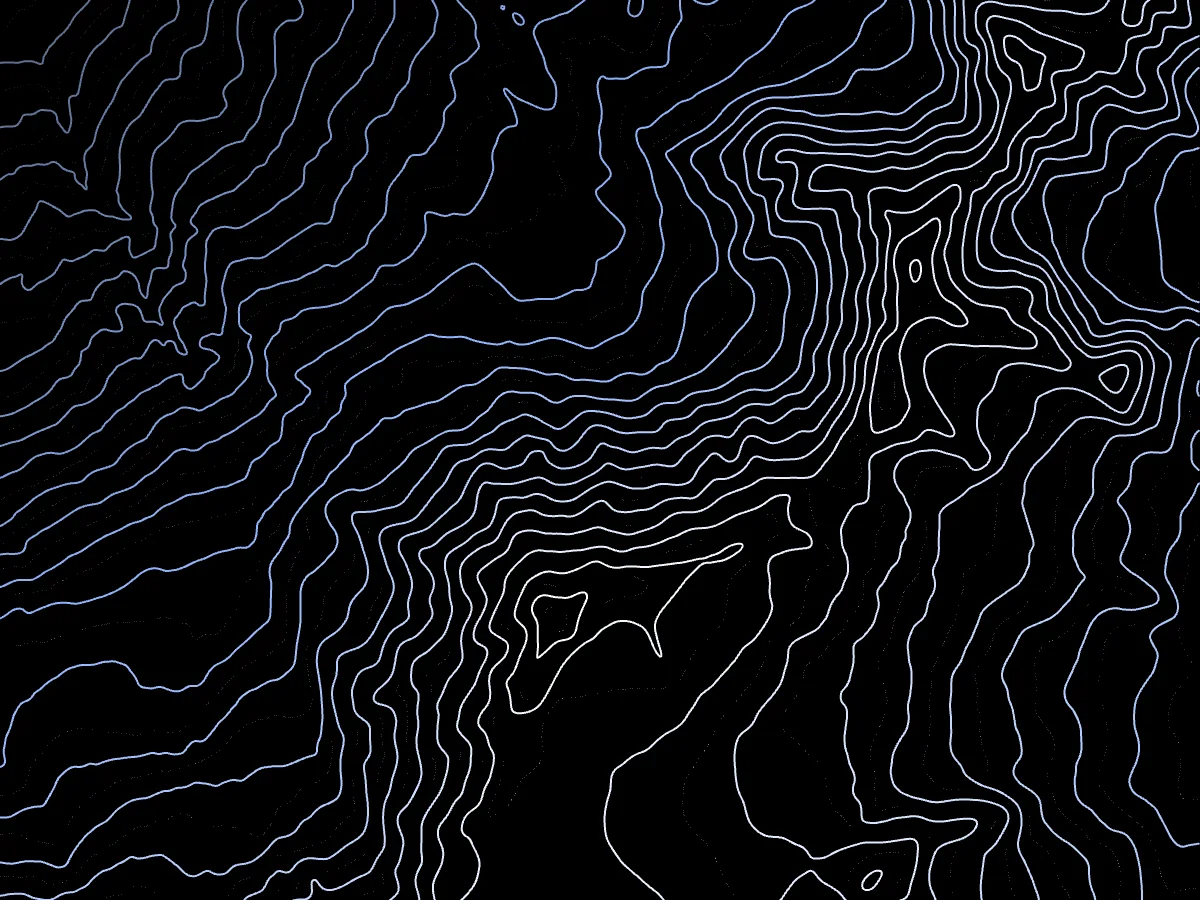
A smaller interval shows more detail but crowds steep slopes; a larger one reads at a glance but hides small features. It also can’t be finer than the elevation data allows: under the US National Map Accuracy Standards, 90 % of tested points must fall within half an interval of their true height. If you’re choosing an interval for your own map, the three checks (data accuracy, line spacing on the steepest slope, number of levels) are in how to choose a contour interval.
Contour interval and index contours in TopoLines
In the TopoLines contour map generator, the interval is the first setting: pick it, draw a zone anywhere in the world, and the lines are traced from real elevation data. Free exports go down to a 25 m interval; with credits you get 5 m and 10 m. Index contours are on by default, one every 5 lines, and you can set every 2nd to 100th line, with their own width, colour and dash style. With credits, contour labels write the elevations along the lines (you choose which ones are labelled), and the export legend states both the contour and the index interval (line styling, cartographic options).
FAQ
What is a contour interval? The difference in elevation between two neighbouring contour lines. It is constant across the map and printed in the legend, for example “contour interval 20 feet”.
How do you find the contour interval? Read it in the map legend. If it isn’t printed, take two neighbouring index contours, subtract their elevations, and divide by the number of spaces between them.
What is the formula for the contour interval? Contour interval = elevation difference between two index contours ÷ number of spaces between them. For 500 ft and 600 ft with four lines in between: 100 ÷ 5 = 20 ft.
What is an index contour? A thicker, labelled contour line, usually every fifth line, that gives a reference elevation to count from.
Contour line, index contour, contour interval: what’s the difference? A contour line joins points of equal height. An index contour is a contour line drawn heavier and labelled. The contour interval is the height step between two neighbouring lines.
How do you determine the interval between index contours? Multiply the contour interval by the number of spaces between two index lines, usually five: a 20 ft interval gives index contours every 100 ft.
What does a contour interval tell you? How much the ground rises or falls from one line to the next. Count the lines between two points and multiply by the interval to get the elevation difference; combined with the distance between them, that gives the slope.
Does a smaller contour interval mean steeper terrain? No. The interval is a choice of the mapmaker. Steepness shows in the spacing of the lines: close together is steep, far apart is gentle.
What is a good contour interval? It depends on scale and terrain: 1–5 m (or 2–10 ft) on flat ground, 10–20 m on hills, 50–100 m in mountains at small scales, and never finer than the elevation data supports.
Pick an interval, choose your index contours, and trace any place in the world. Start free →