A contour line makes a simple promise: every point on it stands at the same height on the ground. Whether it keeps that promise depends on the elevation model it was traced from, and the first thing to know about a model is what it measured: the ground, or whatever stood on it. This page is the first in a short series on when a contour line can be trusted.
A word on where we stand: TopoLines traces GEDTM30 by default, so we have a stake in this question. This page shows why we chose it, and where it fails.
Surface or terrain
A surface model (DSM) records the first thing the sensor meets: tree tops, roofs, bridges. A terrain model (DTM) keeps only the bare ground. The definitions follow the review by Guth et al. (2021). Most free global models are surface models: Copernicus GLO-30 (radar, 2011–2015), SRTM and its 2020 reprocessing NASADEM (radar, February 2000), ALOS AW3D30 (optical stereo). GEDTM30, FABDEM and FathomDEM are terrain models built from them (the full comparison).
Radar does not stop neatly at the top of a tree. Its waves partly enter the foliage, so a radar model lands somewhere inside the canopy, depending on the wavelength (C band for SRTM, X band for Copernicus) and on the season of the flight, since deciduous trees lose their leaves (Ho et al., 2025). Against airborne lidar, Copernicus elevations “cluster tightly near the center of the canopy” in forests, while in open terrain all the global models approximate the ground (Guth & Geoffroy, 2021). Worldwide, the forest bias of SRTM, NASADEM and GLO-30 grows linearly with tree height (Simard et al., 2024).
So the question is not whether a surface model lifts your contours in a forest, but by how much. We measured it.
On a wooded hillside
France’s LiDAR HD programme publishes both the ground (MNT) and the surface (MNS) from the same airborne lidar flights, which makes it a good referee. Below is a 1.3 km line across the wooded hills just north of Gérardmer (Vosges): valley meadows in the middle, woods on either side.
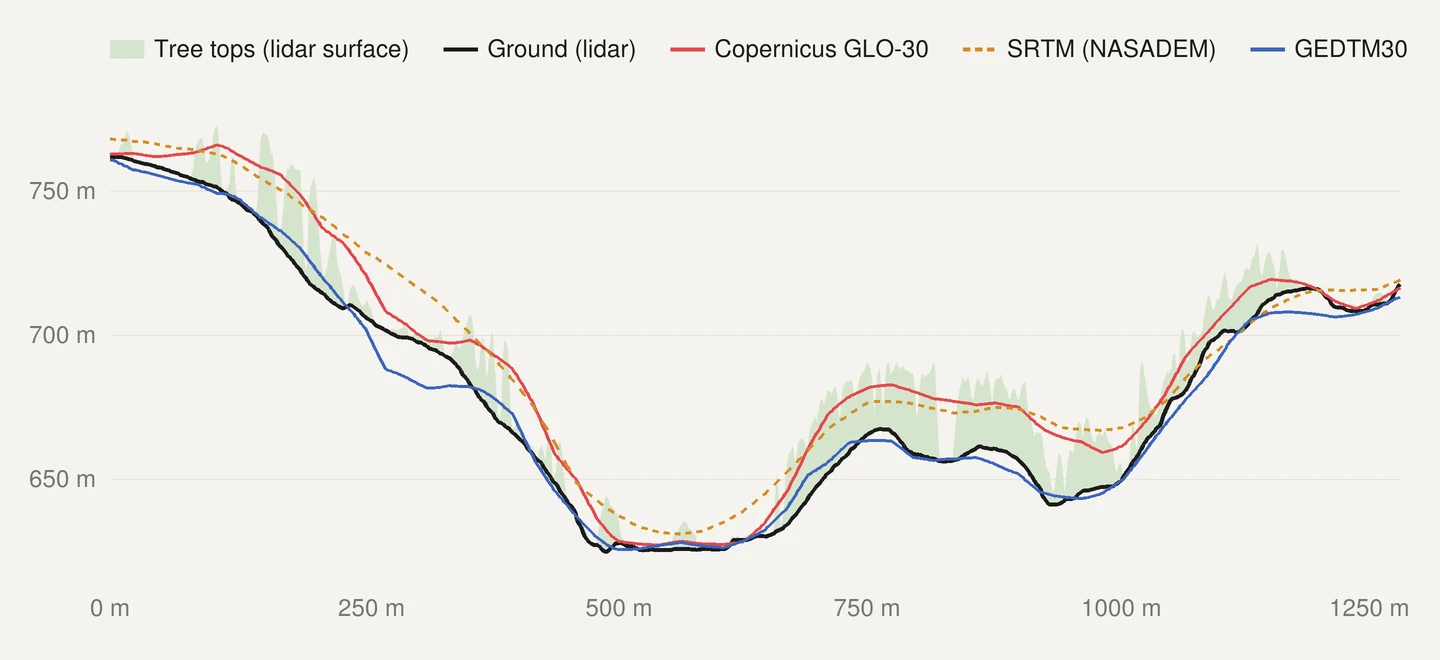
On a map, a lift of the surface shows up as a shift of the line. Here are the same 10 m contours from each model, drawn over the contours of the lidar ground.
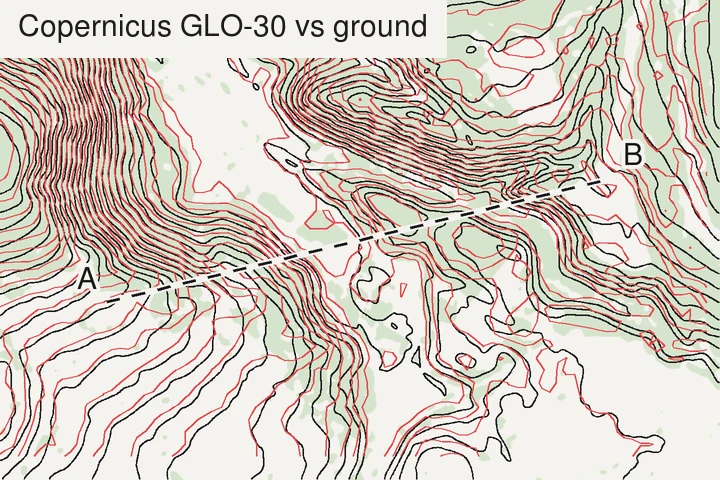
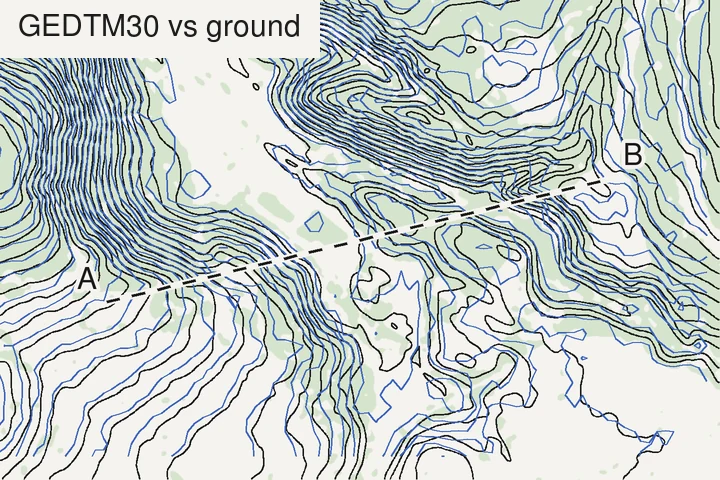
How far does a line move? On a slope of angle θ, a model that stands h metres too high moves each contour downhill by h / tan θ. With a 15 m lift, typical of these woods, that is about 26 m on a 30° slope, 85 m on a 10° slope and nearly 300 m on a 3° slope. This assumes a steady slope and a steady lift; on broken ground both change from place to place, and so does the shift. The gentler the ground, the further the lines wander, which is why forested plains are the worst case: there, a surface model draws the woods rather than the land. Yu-Feng Ho, GEDTM30’s first author, made the same point about coasts in his 2026 OpenGeoHub Summer School talk: a 4 m error barely matters in high mountains, but on low coastal ground it decides where the water reaches.
In a city
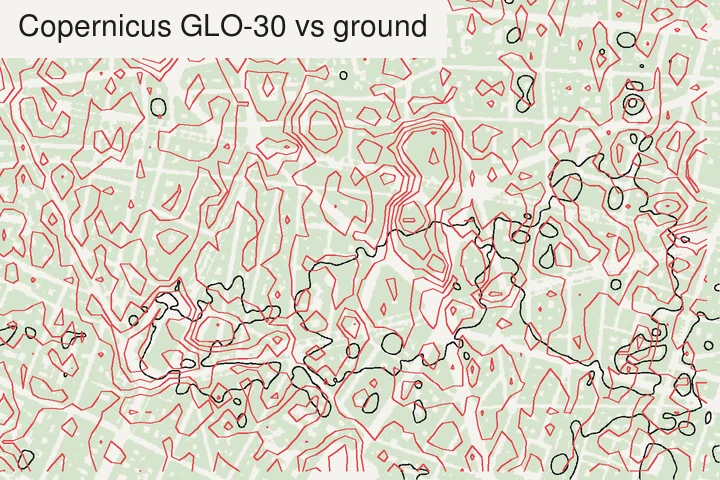
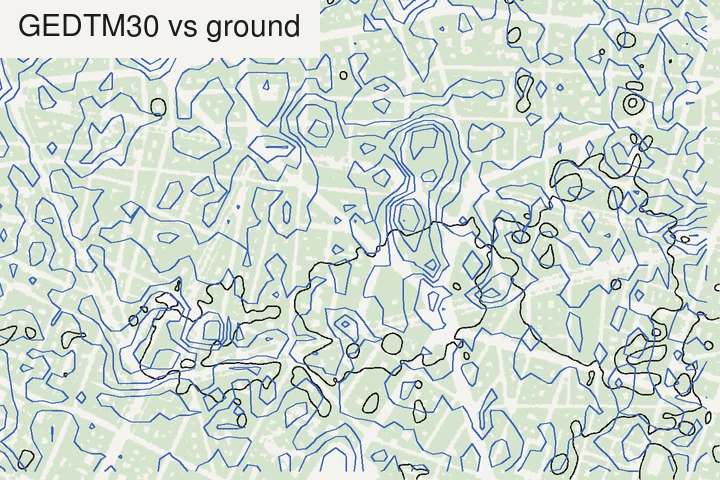
Cities are harder than forests. Around the Opéra and on Lyon’s Presqu’île, where blocks about 18 m tall fill almost every 30 m cell, every global model we tested, the bare-earth GEDTM30 included, sat 12 to 17 m above street level. GEDTM30’s paper reports a 25% cut in Copernicus’s error over built-up areas on average (Ho et al., 2025); dense historic centres are where that average hides the hard cases. For contours of a city’s ground, use a national lidar terrain model.
Even what “the ground” means in a city is not settled. Trees are always removed from a terrain model, but whether buildings should be is still debated, as Ho noted in the same talk. National lidar terrain models such as IGN’s do remove them, which is what lets us measure the gap here.
What we measured
Median height of each model above the lidar ground, over 30 m cells where trees or buildings over 5 m cover more than 80% of the cell:
| Site | What stands on the ground (median height) | Copernicus GLO-30 | SRTM (NASADEM) | GEDTM30 |
|---|---|---|---|---|
| Gérardmer hills (Vosges), woods | 19.7 m | +17.6 m | +15.1 m | +1.1 m |
| Rambouillet forest edge (Yvelines), woods | 17.3 m | +14.7 m | +7.3 m | +2.2 m |
| Opéra, Paris, buildings | 18.8 m | +16.7 m | +14.5 m | +15.7 m |
| Presqu’île, Lyon, buildings | 18.5 m | +13.1 m | +11.8 m | +12.7 m |
On open ground (cells less than 10% covered), Copernicus and GEDTM30 stay within 2 m of the lidar ground at the three sites that have enough of it; SRTM within 3.5 m. Central Paris has almost no open 30 m cell, and even its squares and avenues read about 10 m high, probably because each 30 m cell there takes in some of the blocks around it.
Two patterns stand out. Copernicus sits well up in the trees, in line with Guth & Geoffroy (2021), who found it inside the canopy rather than on the ground. And SRTM sits much lower in the Rambouillet woods than in the Vosges. Its flight in February, when deciduous trees are bare, is one plausible reason, since the season matters (Ho et al., 2025); we did not check the tree species or test it.
GEDTM30, for its part, is close to the ground in the woods but not on it: 1 to 2 m above in the table, and up to 15 m below it on one slope of the profile. It learned where the ground is from satellite lidar heights (GEDI and ICESat-2), and among its inputs are two global canopy height maps trained on GEDI, one of which tends to underestimate tree height and the other to overestimate it (Ho et al., 2025). At the Open-Earth Monitor Global Workshop 2026, Milenković and colleagues showed that against airborne lidar, satellite lidar systematically overestimates low vegetation and underestimates tall vegetation, a bias that filtering reduces but does not remove (Milenković et al., 2026). A model trained on such data inherits part of it; this may explain the small offsets we see, though we did not test it.
How to check your own data
- Read the product type before anything else. “DEM” says nothing. Look for “surface”, “DSM”, “first return”, or for “terrain”, “DTM”, “bare earth” in the documentation.
- Look at a forest edge. Contour a wood that meets a field, every 2 or 5 m. A surface model draws a step along the edge, the height of the trees; a terrain model doesn’t.
- Look at a town. Small closed loops over the blocks, rather than lines running across them, mean you are contouring roofs.
- Subtract the two if you have both. In QGIS, the Raster Calculator on
DSM − DTMgives the height of what stands on the ground (IGN publishes it ready-made as the MNH). Where it is over a few metres, a surface model is not showing the ground. - Prefer national lidar terrain models where they exist. No global ~30 m model is reliable in a dense city centre.
How we measured
- Reference: IGN’s LiDAR HD MNT (ground) and MNS (surface), read at 2 m through IGN’s WMS-R service (IGN, LiDAR HD). Trees and buildings = cells where MNS − MNT exceeds 5 m.
- Models: Copernicus GLO-30 from its open bucket on AWS; NASADEM (Crippen et al., 2016) from Microsoft’s Planetary Computer; GEDTM30 v1.2 from OpenTopography. Each was compared on its own 30 m grid, with the lidar averaged into it.
- Heights are compared as published: NGF-IGN69 for LiDAR HD, EGM2008 for Copernicus and GEDTM30, EGM96 for NASADEM. The agreement on open ground shows these references differ by far less than the offsets under trees and roofs.
- Dates differ. SRTM flew in 2000, Copernicus in 2011–2015, LiDAR HD in the 2020s. Trees grow and get felled, so part of any single offset can be change rather than error; the medians over hundreds to thousands of cells per site are less exposed to it.
- Contours are traced with the same marching-squares code as TopoLines’ exports. The lidar ground was smoothed over about 6 m before tracing, so its lines show the shape of the ground rather than every furrow.
Credit: the comparisons on this page follow ideas from Yu-Feng Ho’s work on GEDTM30, in the GEDTM30 paper (Ho et al., 2025) and in his talk at the OpenGeoHub Summer School 2026, and on the satellite lidar results Milenković presented at the Open-Earth Monitor Global Workshop 2026. The data are LiDAR HD © IGN (Etalab 2.0), Copernicus DEM © DLR e.V. 2010–2014 and © Airbus Defence and Space GmbH 2014–2018 provided under COPERNICUS by the European Union and ESA (all rights reserved), NASADEM by NASA JPL, and GEDTM30 v1.2 by OpenGeoHub (CC BY 4.0).
What TopoLines uses
TopoLines traces GEDTM30 by default. We chose it because it is a terrain model: in the two woods above, its median sits 1 to 2 m above the lidar ground, where Copernicus sits 15 to 18 m up. It fails in dense city centres: around the Opéra in Paris it reads 15.7 m above street level, no better than the surface models.
For HD exports, TopoLines switches to a national terrain model where the datasets docs list one. In metropolitan France that is IGN’s RGE ALTI, a 1 m bare-earth model, served at 1 to 5 m depending on the size of the zone. It is not the LiDAR HD used as the reference on this page: IGN built it from airborne lidar over flood-prone, coastal and large forest areas, and from aerial imagery elsewhere (IGN, RGE ALTI).
Choosing a terrain model is not only a question of accuracy. As Ho warned in his talk, some elevation data are not open at all, and the licence decides what you may do with the rest. That is the subject of the next page in this series: can you sell a map made from this elevation data?
References
- Guth, P. L., Van Niekerk, A., Grohmann, C. H., Muller, J.-P., Hawker, L., Florinsky, I. V., Gesch, D., Reuter, H. I. et al. (2021). Digital elevation models: terminology and definitions. Remote Sensing 13(18), 3581. doi:10.3390/rs13183581
- Guth, P. L. & Geoffroy, T. M. (2021). LiDAR point cloud and ICESat-2 evaluation of 1 second global digital elevation models: Copernicus wins. Transactions in GIS 25(5), 2245–2261. doi:10.1111/tgis.12825
- Simard, M., Denbina, M., Marshak, C. & Neumann, M. (2024). A global evaluation of radar-derived digital elevation models: SRTM, NASADEM, and GLO-30. Journal of Geophysical Research: Biogeosciences 129(11), e2023JG007672. doi:10.1029/2023JG007672
- Ho, Y.-F., Grohmann, C. H., Lindsay, J., Reuter, H. I., Parente, L., Witjes, M. & Hengl, T. (2025). GEDTM30: global ensemble digital terrain model at 30 m and derived multiscale terrain variables. PeerJ 13, e19673. doi:10.7717/peerj.19673
- Crippen, R., Buckley, S., Agram, P., Belz, E., Gurrola, E., Hensley, S., Kobrick, M., Lavalle, M. et al. (2016). NASADEM global elevation model: methods and progress. ISPRS Archives XLI-B4, 125–128. doi:10.5194/isprs-archives-XLI-B4-125-2016
- IGN (2026). MNT LiDAR HD. data.gouv.fr.
- IGN (2026). RGE ALTI®. cartes.gouv.fr.
- Ho, Y.-F. (2026). Derive and apply multiscale terrain variables in environmental research. OpenGeoHub Earth Observation Summer School 2026, Istanbul (recorded talk).
- Milenković, M., Ho, Y.-F. & Santoro, M. (2026). Satellite lidar data in support of forest biomass mapping. Open-Earth Monitor Global Workshop 2026, Barcelona (recorded talk).
Last updated 11 November 2026