Accuracy is often stated as an RMSE in metres. Sometimes it is stated as a slope or curvature score. However, the viewer of the map will not see the elevation values, they will only see the line. This page assesses the accuracy of the line. This is the fourth in a short series on the accuracy of contour lines. The previous pages cover what was measured, what the licence allows and how uncertain the model is.
The contours from three global models were traced: GEDTM30 v1.2, Copernicus GLO-30 and FABDEM V1-2, plus IGN aerial lidar data. The lidar was averaged to create 30 m cells like the models. The contours were then compared line by line. As the lidar is on the same grid as the model, we can be sure any differences are purely due to the model error.
GEDTM30 is the model TopoLines uses on the free tier, and the contours were traced using TopoLines’ code. As the process of creating the contours is the same for each model, it shows the contours as they would appear on TopoLines. Similarly, as the process is the same for the lidar, any differences between two models are due to the models themselves.
This highlighted a bug in my tracer. The lidar averaged to 30 m sat a median 11 m from the same lidar at 6 m, which looked wrong. The cause: all the contours created by TopoLines were half a cell too far north-west. On GEDTM30 this was about 10 m west and 15 m north. This bug was fixed in v2.54.1. All figures use the fixed contours.
Five sites
Four of the sites are the same as on the previous page. Causse Méjean has been added. It is an open limestone plateau. It was chosen as GEDTM30 has been criticised in the literature for not being accurate over bare ground.
| Site | Median slope | Wooded cells | RMSE, GEDTM30 | RMSE, Copernicus | RMSE, FABDEM |
|---|---|---|---|---|---|
| Lac de Gérardmer (Vosges), lake and woods | 11° | 34% | 4.0 m | 11.9 m | 5.0 m |
| Chamonix valley (Haute-Savoie), mountain | 27° | 29% | 7.0 m | 10.6 m | 7.9 m |
| Central Vercors (Drôme), plateau and slope | 18° | 41% | 4.4 m | 7.8 m | 4.9 m |
| Rambouillet forest edge (Yvelines), flat | 0.9° | 24% | 4.0 m | 8.9 m | 2.9 m |
| Causse Méjean (Lozère), open plateau | 8° | 9% | 1.7 m | 2.8 m | 1.6 m |
Accuracy
RMSE shows how far each model is from the lidar ground value in each cell. As Copernicus is a surface model, most of its error is due to the trees. Over wooded cells, Copernicus elevations are 7 to 16 m above the ground on all five sites. GEDTM30 is much more accurate, within about 2 m of the ground. Rambouillet and Gérardmer are the same in terms of RMSE (both 4.0 m). However, their contours give very different results.
How far off?
Each model’s contours were traced and compared to the lidar contours of the same level. The contours were traced as they would be exported from TopoLines. This means that the grid was smoothed slightly (2 cell Gaussian filter) and then contoured using the marching squares algorithm. The contours were all created with a contour interval of 10 m. The distance to the lidar was measured every 5 m along each line, and the median and 90th percentile (P90) were taken for each site and model. This is how the contours are exported, so they include the smoothing. The grids as published, unsmoothed, are covered further down.
| Site | GEDTM30 | Copernicus GLO-30 | FABDEM |
|---|---|---|---|
| Gérardmer | 6 m / 20 m | 35 m / 86 m | 9 m / 28 m |
| Chamonix | 5 m / 14 m | 10 m / 32 m | 8 m / 19 m |
| Vercors | 7 m / 14 m | 14 m / 31 m | 8 m / 15 m |
| Rambouillet | 67 m / 440 m | 133 m / 754 m | 53 m / 512 m |
| Causse Méjean | 6 m / 15 m | 5 m / 34 m | 5 m / 12 m |
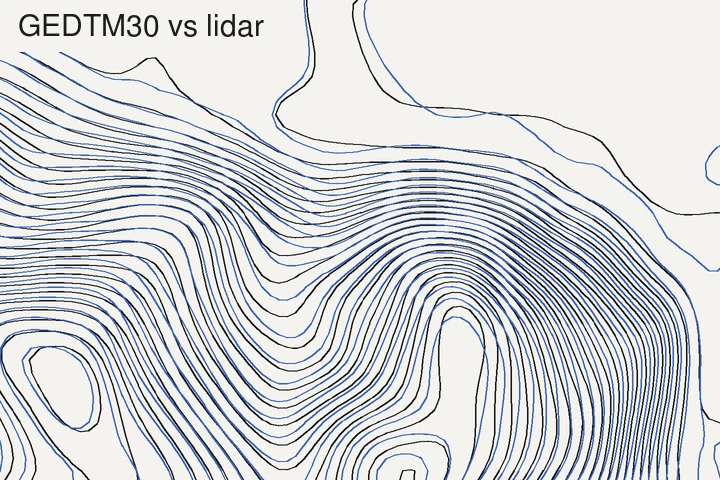
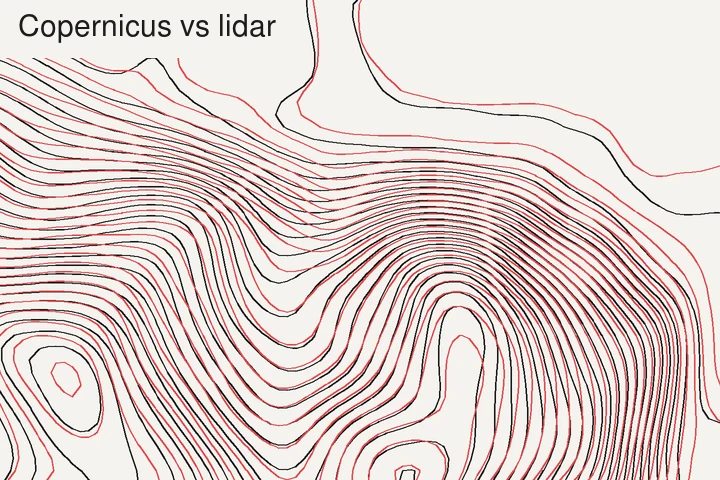
The contours from GEDTM30 on the four sites with relief were between 5 and 7 m away from the lidar (median). 90% of the contour length was within 14 to 20 m. This is less than a cell away. FABDEM was very similar. Copernicus was 2 to 6 times further away. As Copernicus is a surface model, it is raised by 9 to 16 m on these sites. This pushes the contours downhill by the canopy height divided by the slope (see the first page). On the open site (Causse Méjean) all three models were within 1 m of each other.
To see how precise these values are: the points were not independent, as they were 5 m apart on the same line. Instead, each site was divided into 500 m sections and the sections were sampled 2,000 times. 95 times out of 100 the median would be within:
| Site | GEDTM30 | Copernicus GLO-30 | FABDEM |
|---|---|---|---|
| Gérardmer | 5–7 m | 29–43 m | 7–12 m |
| Chamonix | 4–6 m | 6–16 m | 6–9 m |
| Vercors | 5–8 m | 11–17 m | 6–9 m |
| Rambouillet | 44–122 m | 97–214 m | 38–88 m |
| Causse Méjean | 5–7 m | 4–6 m | 5 m |
The sections were the same for each model, so the models could be compared. GEDTM30 was more accurate than Copernicus at four sites. However, on the open site they could not be told apart. GEDTM30 was more accurate than FABDEM at Gérardmer and Chamonix (by 1 to 5 m and 2 to 4 m respectively). In the Vercors, at Rambouillet and on the Causse Méjean, GEDTM30 and FABDEM could not be told apart. The difference at Rambouillet between FABDEM (53 m) and GEDTM30 (67 m) is not a real difference. These values show how precisely the sites were measured. They do not say anything about sites not measured.
Some of the distances are unrelated to the shape. All models are slightly higher or lower overall than the lidar (−1.0 to 0.0 m for GEDTM30 over the five sites). This is partly because the heights are referenced differently. All three models use EGM2008 and the lidar uses NGF-IGN69. On the Causse Méjean all three models are 0.7 to 0.8 m below the lidar. If we take out the offset, the median distance for Copernicus and FABDEM drops from 5 m to 0.9 m. GEDTM30 only drops by 1 m, to 5 m. This means that GEDTM30’s error there is not an offset.
No contours were invented or lost over the sites with relief. For GEDTM30 and FABDEM, less than 1% of the contour length had no contour of the same level within 100 m. Rambouillet was different, as shown below.
Error dependent on slope
If there is an elevation error, the contours move horizontally. The amount they move is equal to the error divided by tan(slope). So a 2 m error would move the contours 3.5 m on a 30° slope, 23 m on a 5° slope and 115 m on a 1° slope.
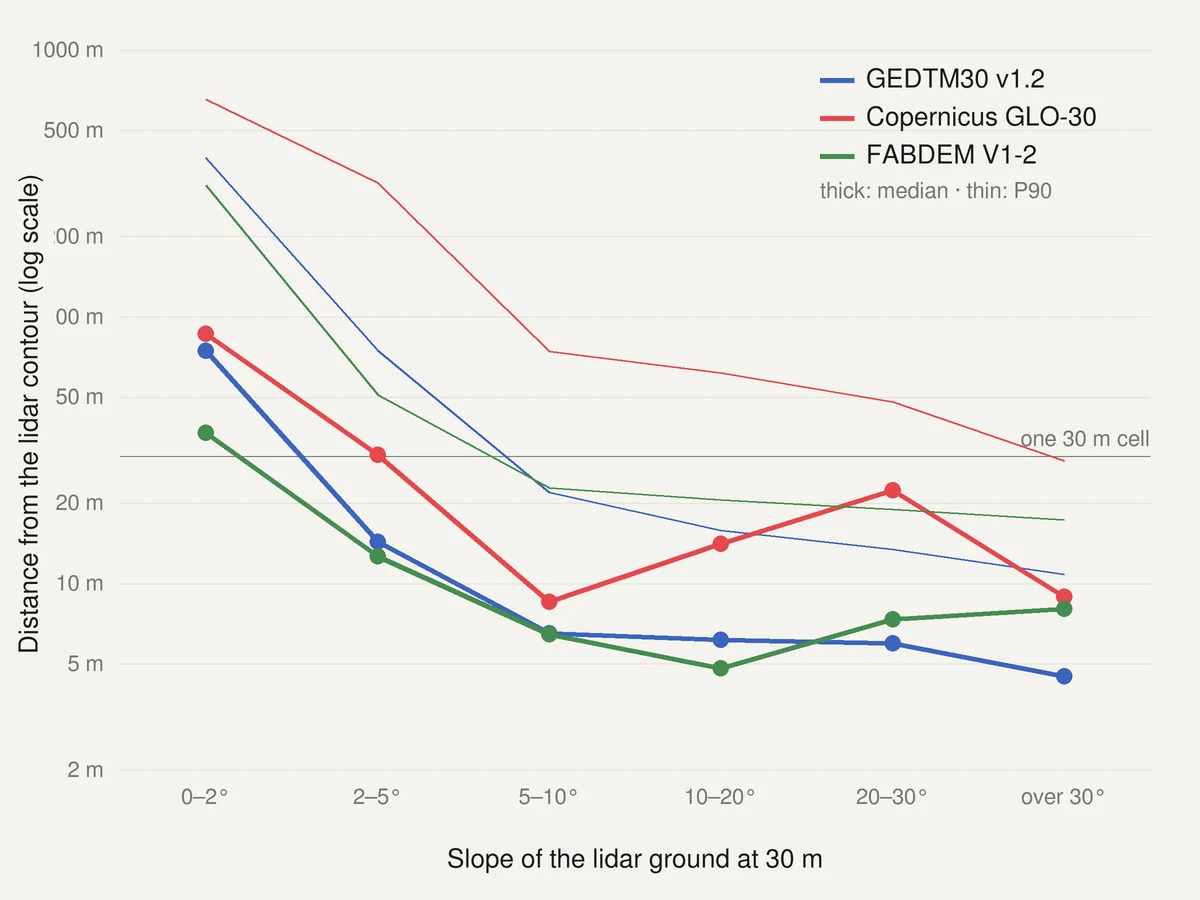
For GEDTM30, the median distance was 74 m for slopes under 2°, 14 m for 2 to 5°, about 6 m for 5 to 30° and 4.5 m above 30°. Even though Chamonix had the biggest elevation error (7.0 m RMSE), it had the best positioned contours.
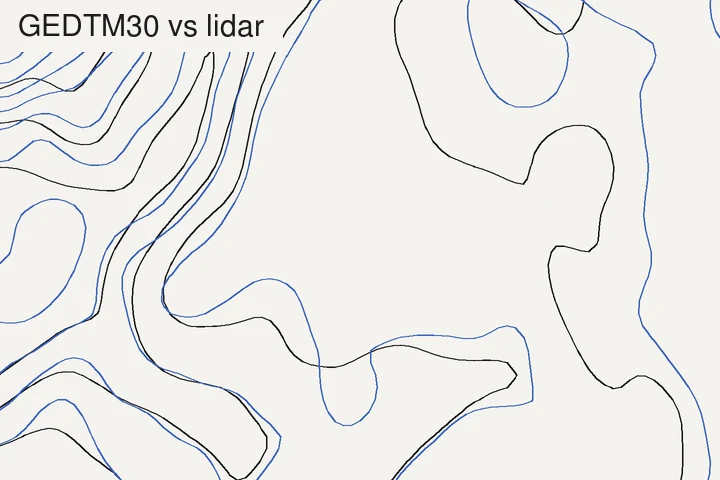
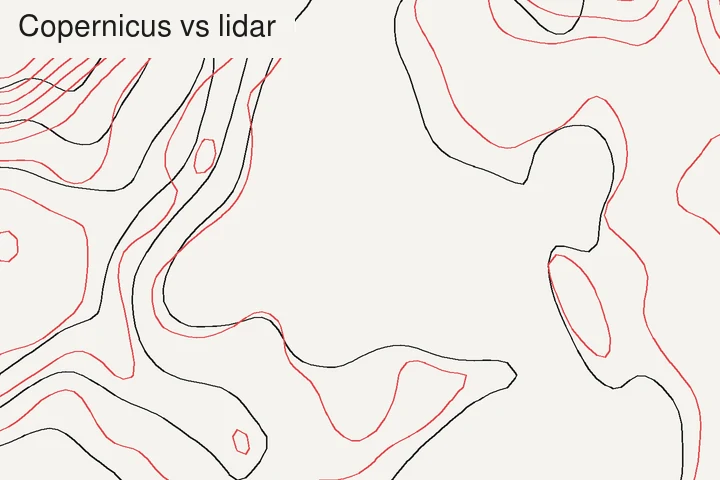
Rambouillet could not be compared line by line. With a 10 m interval, 46% of the GEDTM30 contour length was more than 100 m away from any lidar contour of the same level. 12% of the lidar contours had no GEDTM30 contour within 100 m. GEDTM30 had 1.7 times as much contour length as the lidar. The same two shares were 74% and 41% for Copernicus, and 36% and 24% for FABDEM. None of the 30 m models traced this flat area.
Interval does not affect accuracy
The accuracy of the line is not affected by the interval. The 20 m contours are a subset of the 10 m contours, so the medians are the same (within 1 m) at 5, 10 and 20 m. Rambouillet has too few contours to check this. However, the interval does affect how big an issue the error is: whether you risk confusing a contour with the next one.
Typically the vertical rule of the US National Map Accuracy Standards is used to validate contour accuracy. It states that no more than 10% of the elevations can be more than half the contour interval away from the correct value. This is just used as a benchmark. Passing it here does not mean the map complies with the standard. Percentage of GEDTM30 cells off by more than:
| Site | 2.5 m (5 m interval) | 5 m (10 m interval) | 10 m (20 m interval) |
|---|---|---|---|
| Gérardmer | 42% | 20% | 2% |
| Chamonix | 55% | 30% | 11% |
| Vercors | 45% | 20% | 3% |
| Rambouillet | 34% | 16% | 3% |
| Causse Méjean | 14% | 1% | 0% |
This can be reversed to see what interval can be supported. It is twice the LE90, which is how much error 90% of the cells are within (see choosing a contour interval).
| Site | GEDTM30 | Copernicus GLO-30 | FABDEM |
|---|---|---|---|
| Gérardmer | 14 m | 42 m | 17 m |
| Chamonix | 21 m | 36 m | 26 m |
| Vercors | 14 m | 27 m | 16 m |
| Rambouillet | 14 m | 34 m | 9 m |
| Causse Méjean | 6 m | 11 m | 4 m |
GEDTM30 can support a 20 m interval on 4 out of 5 sites. Chamonix failed due to the high error on the steep wooded slopes. It can only support a 10 m interval on open areas. It does not support a 5 m interval on any site. Rambouillet shows the limit of the rule. Its elevations support a 14 m interval, yet it had the worst contours. The vertical rule tells you that the contours will not be confused with the next contour. It does not tell you anything about how the contours will behave on flat areas.
Is GEDTM30 rougher?
The biggest criticism in the literature (see below) is that GEDTM30 has a fine level of roughness that isn’t present in reality. Contours are a great way to see this, as roughness in the grid causes the contours to wiggle. I measured the wiggling on the grids exactly as they were published. No smoothing was applied. It was measured as the average change in heading of the contour, in degrees per 100 m of line.
| Site | Lidar at 30 m | GEDTM30 | Copernicus GLO-30 | FABDEM |
|---|---|---|---|---|
| Gérardmer | 50° | 84° (+69%) | 76° (+52%) | 66° (+32%) |
| Chamonix | 51° | 70° (+36%) | 52° (+1%) | 45° (−11%) |
| Vercors | 45° | 50° (+10%) | 46° (+1%) | 40° (−12%) |
| Rambouillet | 97° | 182° (+88%) | 158° (+63%) | 145° (+49%) |
| Causse Méjean | 53° | 59° (+13%) | 53° (0%) | 50° (−5%) |
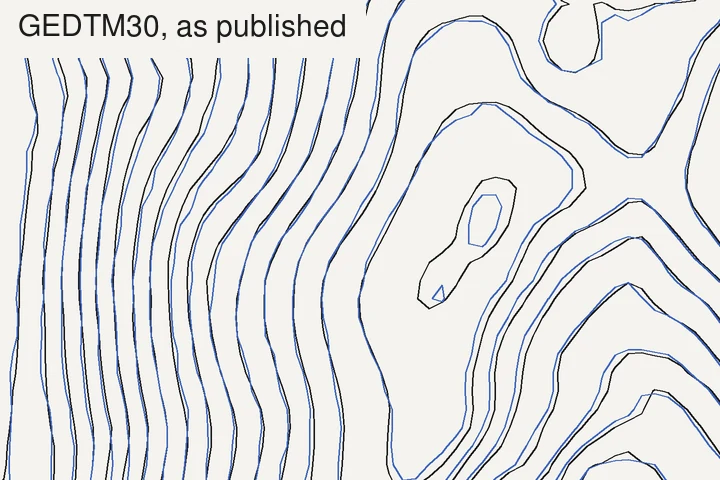
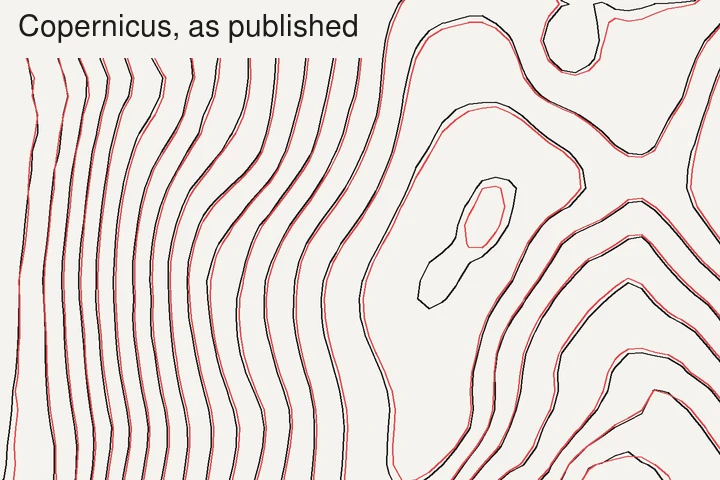
Yes. The contours on GEDTM30 wiggle more than the lidar on all 5 sites (from 10% more in the Vercors to 69% more at Gérardmer). Copernicus wiggled in line with the ground on open and steep areas (within 2% at Chamonix, Vercors and Causse Méjean). Only on wooded and flat areas was it different. FABDEM was smoother than the real ground on 3 sites. The grids show the same. GEDTM30’s standard deviation of second differences (a simple measure of curvature) was 1.2 to 1.8 times the lidar’s on the 4 sites with relief. Copernicus’s was 0.9 to 1.0 times the lidar’s on 3 sites.
Roughness causes additional loops. The number of small loops (under 600 m perimeter) with no closed contour of the same level within a cell were:
| Site | Small loops in the lidar | Invented, GEDTM30 | Invented, Copernicus | Invented, FABDEM |
|---|---|---|---|---|
| Gérardmer | 29 | 66 | 90 | 24 |
| Chamonix | 7 | 55 | 44 | 2 |
| Vercors | 3 | 10 | 9 | 6 |
| Rambouillet | 29 | 292 | 302 | 93 |
| Causse Méjean | 17 | 10 | 11 | 4 |
As there are no trees to remove on bare ground, the models that have been designed to remove them perform worse than Copernicus. Removing the offset from the open cells on the Causse Méjean (79% of the site) gave a standard deviation of elevation error of 0.3 m for Copernicus, 0.5 m for FABDEM and 1.4 m for GEDTM30. Guth et al. (2025) found the same results on barren tiles. It also occurred on the open cells in the Vercors (the other plateau): Copernicus had a standard deviation of 0.9 m and GEDTM30 1.9 m. However, it was not the case everywhere. On the open cells at Gérardmer, Chamonix and Rambouillet (meadows and fields between wooded areas), GEDTM30 had the smaller standard deviation of the two. I’m unsure why.
Very few people contour raw grids. Using the slight smoothing applied by TopoLines, all 3 models wiggled within 10% of the lidar on the 4 sites with relief (GEDTM30: +4%, −4%, −4%, −1%). GEDTM30 had 0, 0, 0 and 3 additional small loops. The roughness is real but small, and can be filtered out by using a 2 cell filter. Rambouillet was an exception, with 11 additional loops for GEDTM30, 16 for Copernicus and 1 for FABDEM.
Cost of smoothing
To see how much the filter affects the data, the lidar was compared to itself: the lidar averaged to 30 m against the lidar at 6 m, contoured the same way as the models.
| Site | 30 m, not smoothed: median / P90 | 30 m, smoothed: median / P90 | Contour length lost | Small loops, 30 m smoothed / 6 m |
|---|---|---|---|---|
| Gérardmer | 0.5 m / 1.7 m | 6 m / 21 m | 11% | 2 / 21 |
| Chamonix | 0.5 m / 1.5 m | 5 m / 15 m | 6% | 0 / 4 |
| Vercors | 0.5 m / 1.6 m | 5 m / 17 m | 7% | 1 / 4 |
| Rambouillet | 1.0 m / 3.8 m | 12 m / 29 m | 30% | 1 / 13 |
| Causse Méjean | 0.5 m / 1.4 m | 8 m / 22 m | 13% | 6 / 15 |
Sampling the ground every 30 m caused little error in the position (0.5 m median). However, smoothing the grid caused the contours to move by 5 to 8 m on the relief sites. This is roughly equal to GEDTM30’s error. Smoothing also caused spurs, gullies and small peaks to be smoothed out. This caused 6 to 13% of the contour length to be lost, plus most of the small closed loops. A perfectly accurate 30 m model would still be this far away from the ground if it was contoured this way.
All together, GEDTM30 contoured as exported by TopoLines, compared to the 6 m lidar contours, gave a median of 8 to 10 m and a P90 of 22 to 28 m on the 4 relief sites, and 49 m and 339 m at Rambouillet.
When is 30 m enough?
The two measures were these. On paper, half a millimetre is roughly the width of an index contour. It is also close to the horizontal tolerance set by the same standard for well-defined points on maps at scales of 1:20,000 and smaller (1/50 inch). In terms of height, it is half the interval for 90% of points.
| Use | GEDTM30, hills and mountains | GEDTM30, flat ground (under 2°) |
|---|---|---|
| 1:100,000 and smaller, 20 m interval and up | Enough: 90% of the line within 0.3 mm | Position not reliable: P90 is 3 mm |
| 1:50,000, 20 m interval | Enough, at the limit: P90 of 22 to 28 m is 0.4 to 0.6 mm. Steep woods fail the height rule by a point | Not enough |
| 1:25,000, 10 m interval | Not enough: P90 is about 1 mm, and 20 to 30% of heights are off by more than half the interval (1% on open ground) | Not enough |
| Any scale, 5 m interval | Not enough: 14 to 55% of heights are off by more than half the interval | Not enough |
| Poster, illustration, 3D print | Enough: shapes and landforms are right, lines are not invented | Lines there are indicative at best |
These are order of magnitude values, taken from 5 sites in France. I would not consider them to be tolerances. There are 3 factors to consider.
Trees. With a surface model like Copernicus, distances and intervals will be double or more where there are trees.
Open areas. All 3 models were very similar. Once the offset was removed, Copernicus and FABDEM had a median distance of less than a metre. GEDTM30 and FABDEM could support the 10 m interval.
Flat areas. None of the models placed contours correctly below about 2° of slope, at any interval. Between 2 and 5°, expect a 14 m median and a 75 m P90 from GEDTM30.
If 30 m is not enough for your map, a better 30 m model won’t help. Try using a national lidar model if available. See the Atlas pages for France and the United States.
Summary of the published debate
Three papers from the same journal, read on 13 November 2026.
Benchmark. Guth et al. (2025) compared 6 global 1 arc-second models using lidar terrain models averaged to the same cells. This was done over 1,510 tiles (about 10 × 10 km) in the United States and western Europe. They used the proportion of unexplained variance (1 − r²) between the model and reference to measure accuracy. This was done for both elevation and derived grids (slope, curvature). They found FathomDEM to be the best. Copernicus was the best with no licence restrictions. ALOS AW3D30 was best for steep mountains. They also state “GEDTM performed poorly”, especially for curvature.
Comment. Ho et al. (2026), from OpenGeoHub, recreated the benchmark as a public pipeline. This was done on 36 tiles in the Netherlands, Switzerland, the United States and Australia. They tried 9 single-cell offsets for each tile and kept the best one. They then tested the differences using a Kruskal–Wallis test. They also found FathomDEM was the best, and no statistically significant difference between the 4 models. GEDTM30 v1.2 was the best open model for elevation and slope. Their conflict-of-interest statement says all authors work for OpenGeoHub and the first author is the main author of GEDTM30.
Response. Guth et al. (2026) stand by their conclusions. They disagree with the sample size (they count 26 usable tiles against their 1,510, mostly flat and wooded or urban). They disagree with the Copernicus file used (an integer height file, where a decimal one exists). They disagree with the models being reprojected, some twice. They also disagree with the test method, as models measured on the same tile were treated as independent. They added 142 tropical tiles from French overseas regions, and a hillshade of bare lava in Lanzarote. This showed GEDTM30 had roughness and pits that were not present in the lidar. The original paper states three of its authors also took part in creating GEDTM30.
Agreements. FathomDEM is the best if its licence is acceptable. The lidar was focused on Europe and North America, so we do not know how any of this would work elsewhere. GEDTM30 behaves as a compromise between its two main inputs (Copernicus and ALOS) for measures like curvature. This is stated by both sides. GEDTM30 is the only corrected terrain model with published code. This is noted by the benchmark authors.
Disagreements. Whether the differences are large enough to matter. How the grids should be registered. How many tiles of what terrain should be used to rank.
None of the papers looked at contour lines. My five sites cannot settle a ranking made over 1,510 tiles, and all were in France. For what they are worth, they sit somewhere between the two readings. GEDTM30 had better positioned contours than Copernicus wherever there were trees, at my sites. However, it also had a rougher surface than the real ground (measurable and visible), and it performed worse than Copernicus on bare ground.
Methods
Data. GEDTM30 v1.2 terrain data from the 30 m file on OpenGeoHub (Zenodo). Copernicus GLO-30 (decimal heights) from the public AWS bucket (doi.org/10.5270/ESA-c5d3d65). FABDEM V1-2 from the University of Bristol (doi.org/10.5523/bris.s5hqmjcdj8yo2ibzi9b4ew3sn). IGN LiDAR HD MNT (ground) and MNS (surface) data read at 2 m through IGN’s WMS-R service (IGN, LiDAR HD).
Sites. Gérardmer (4.5 × 3 km), Chamonix (3.6 × 2.4 km), Vercors (3 × 2 km), Rambouillet and Causse Méjean (4.5 × 3 km). Each had between 8,905 and 21,437 cells. All grids were read 300 m larger than the frame, to ensure nothing was measured next to the edge of a grid.
Reference. Lidar ground data averaged into the 1 arc-second cells of each model. No resampling or reprojection of the models. Heights were compared as published (EGM2008 for the models, NGF-IGN69 for the lidar). To remove the offset, the site’s median difference was used. Wooded cells were more than 80% covered by objects over 5 m. Open cells were less than 10% covered by objects over 5 m (lidar surface minus ground).
Registration. The horizontal offset was estimated from the difference in height and the slope. GEDTM30 had an offset of 5 m or less on all sites. FABDEM had an offset of 8 m or less, and Copernicus 12 m or less, on the 4 relief sites. This is a fraction of a cell. Under trees, part of Copernicus’s estimated shift is canopy, not registration.
Contouring. Contoured using the same marching squares code as TopoLines exports, twice: once on the grid as published, and once after applying the 2 cell Gaussian filter. The model and reference are always treated identically. All grid values sit at the centre of their cell.
Distance. Points every 5 m along each model contour. Distance to the nearest point on the reference contours of the same level (sampled every metre). Only within the frame. Median and 90th percentile of all points. No counterpart means more than 100 m away.
Interval. Spatial block bootstrap. Each frame divided into 500 m sections (24 to 54 depending on the site). Sections sampled with replacement 2,000 times, keeping all the contour points in each section. The interval is the 2.5th to 97.5th percentile of the medians. The same draws were used for all 3 models, which gives the interval of a difference.
Wiggle. Contours resampled every 10 m. Average absolute change in heading per 100 m.
Loops. Closed contours with a perimeter under 600 m. A loop counts as invented if no closed reference contour of the same level touches it or lies within 30 m of it.
Lidar at 6 m. The 2 m ground averaged over 3 × 3 cells, smoothed with a 2 cell Gaussian filter.
Limitations. There are five sites, all in France, with between 200 and 420 km of 10 m contours in relief and 37 km at Rambouillet. This means that the flat land figures are based on few lines. The lidar and model data are from different years. Copernicus is a surface model: its error compared to the ground is largely what it was created to measure.
Replicability. All data and figures on this page were generated by one script, in
TopoLines’ repository: backend/scripts/atlas_contour_error.py. It downloads the data,
prints the tables and plots the figures.
Credit. GEDTM30 v1.2 by Ho & Hengl, OpenGeoHub, CC BY 4.0 (doi.org/10.5281/zenodo.18887460, paper: Ho et al., 2025). Produced using Copernicus WorldDEM-30 © DLR e.V. 2010–2014 and © Airbus Defence and Space GmbH 2014–2018, provided under COPERNICUS by the European Union and ESA; all rights reserved. FABDEM V1-2 by Neal & Hawker, University of Bristol and Fathom (Hawker et al., 2022), CC BY-NC-SA 4.0: only used for the comparison tables, no figure is plotted from it, and TopoLines does not serve it. LiDAR HD © IGN, Etalab 2.0. The benchmark, comment and reply are open access under CC BY 4.0. No figures of theirs were reproduced.
What TopoLines uses
TopoLines traces GEDTM30 on the free tier, and wherever no national model covers the area. Paid exports use national lidar terrain models where they exist, such as IGN’s RGE ALTI in France or USGS 3DEP in the United States. All grids are smoothed over two cells before tracing.
What I do with these numbers on GEDTM30: keep to 20 m contours or wider in relief, do not read position off the lines in flat areas, and switch to the high-resolution source for anything at 1:25,000 or with a 10 m interval. The smoothing takes GEDTM30’s roughness out of the lines, and you now know what it costs.
The models used are all open because their authors made them open. The benchmark, comment and reply are also open, with their data. Thanks to their effort, this test could be run in a short time with a script.
References
- Guth, P. L., Trevisani, S., Grohmann, C. H., Lindsay, J. B. & Reuter, H. I. (2025). Benchmarking elevation plus land surface parameters finds FathomDEM and Copernicus DEM win as best global DEMs. Remote Sensing 17(23), 3919. doi:10.3390/rs17233919
- Ho, Y.-F., Xu, Q., Chiriac, O. P., Isik, M. S. & Hengl, T. (2026). Comment on Guth et al. Benchmarking elevation plus land surface parameters finds FathomDEM and Copernicus DEM win as best global DEMs. Remote Sens. 2025, 17, 3919. Remote Sensing 18(14), 2382. doi:10.3390/rs18142382
- Guth, P. L., Trevisani, S., Grohmann, C. H. & Lindsay, J. B. (2026). Reply to Ho et al. Comment on “Guth et al. Benchmarking elevation plus land surface parameters finds FathomDEM and Copernicus DEM win as best global DEMs. Remote Sens. 2025, 17, 3919”. Remote Sensing 18(14), 2399. doi:10.3390/rs18142399
- Ho, Y.-F., Grohmann, C. H., Lindsay, J., Reuter, H. I., Parente, L., Witjes, M. & Hengl, T. (2025). GEDTM30: global ensemble digital terrain model at 30 m and derived multiscale terrain variables. PeerJ 13, e19673. doi:10.7717/peerj.19673
- Ho, Y. & Hengl, T. (2026). Global Ensemble Digital Terrain Model 30m (GEDTM30), v1.2.0. Zenodo. doi:10.5281/zenodo.18887460
- European Space Agency (2022). Copernicus DEM. European Space Agency (instance used here: GLO-30). doi:10.5270/ESA-c5d3d65
- Neal, J. & Hawker, L. (2023). FABDEM V1-2. University of Bristol data repository. doi:10.5523/bris.s5hqmjcdj8yo2ibzi9b4ew3sn
- Hawker, L., Uhe, P., Paulo, L., Sosa, J., Savage, J., Sampson, C. & Neal, J. (2022). A 30 m global map of elevation with forests and buildings removed. Environmental Research Letters 17, 024016. doi:10.1088/1748-9326/ac4d4f
- IGN (2026). MNT LiDAR HD. data.gouv.fr.
- U.S. Bureau of the Budget (1947). United States National Map Accuracy Standards. reproduced in USGS, Map Accuracy (National Mapping Program fact sheet).
Last updated 13 November 2026