TopoLines started with one idea: take real elevation data for any place on Earth and turn it into clean contour lines you can actually use. 2.0 keeps that idea and adds a second way of reading the same terrain.
Points: the same terrain, read differently
Contour lines describe a landscape by its edges: every line is one altitude. That works well, but it isn’t the only way to show relief.
Points draws the same elevation model as a field of marks — dots, squares or crosses — whose size and density follow the height. Low ground goes sparse, peaks go dense. Nothing is invented: it’s the exact same data the contours are traced from, sampled differently.
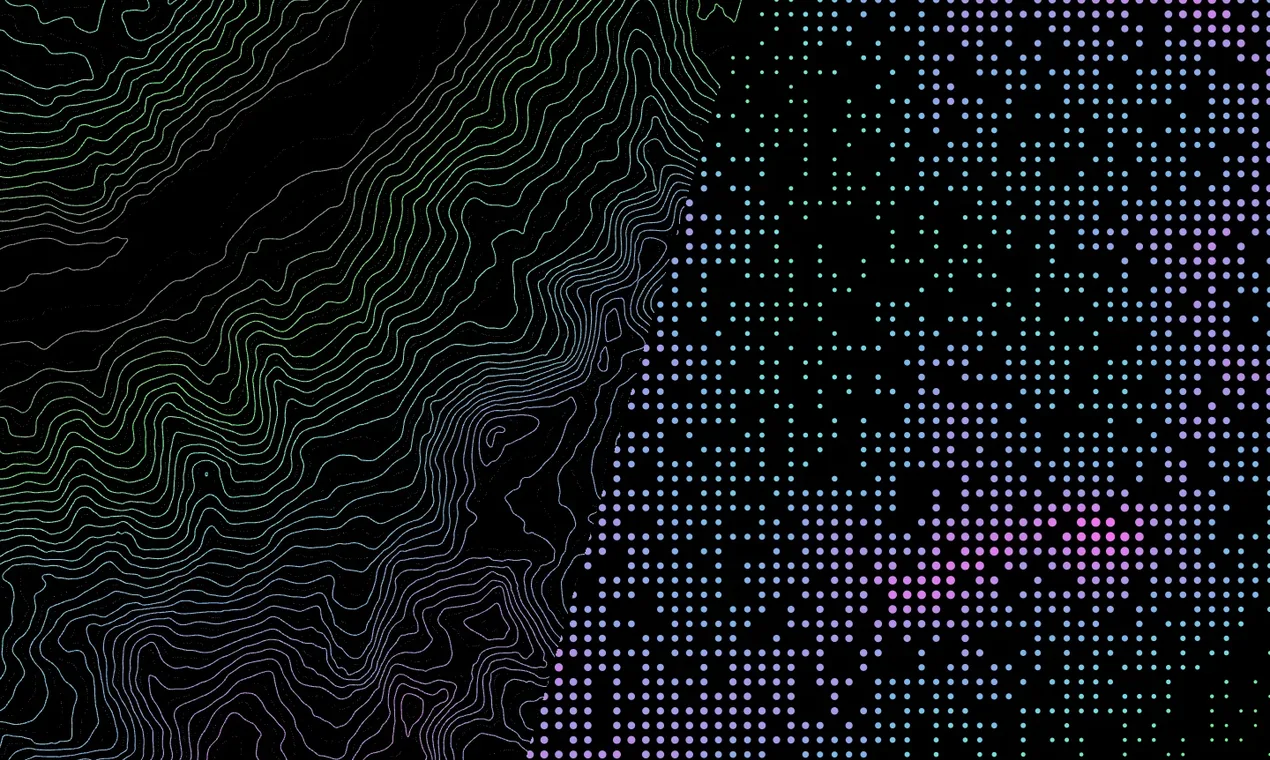
In the editor it’s a single switch in Settings. Pick a zone, flip Lines to Points, and the preview redraws from the same trace — no new download, no new credits.
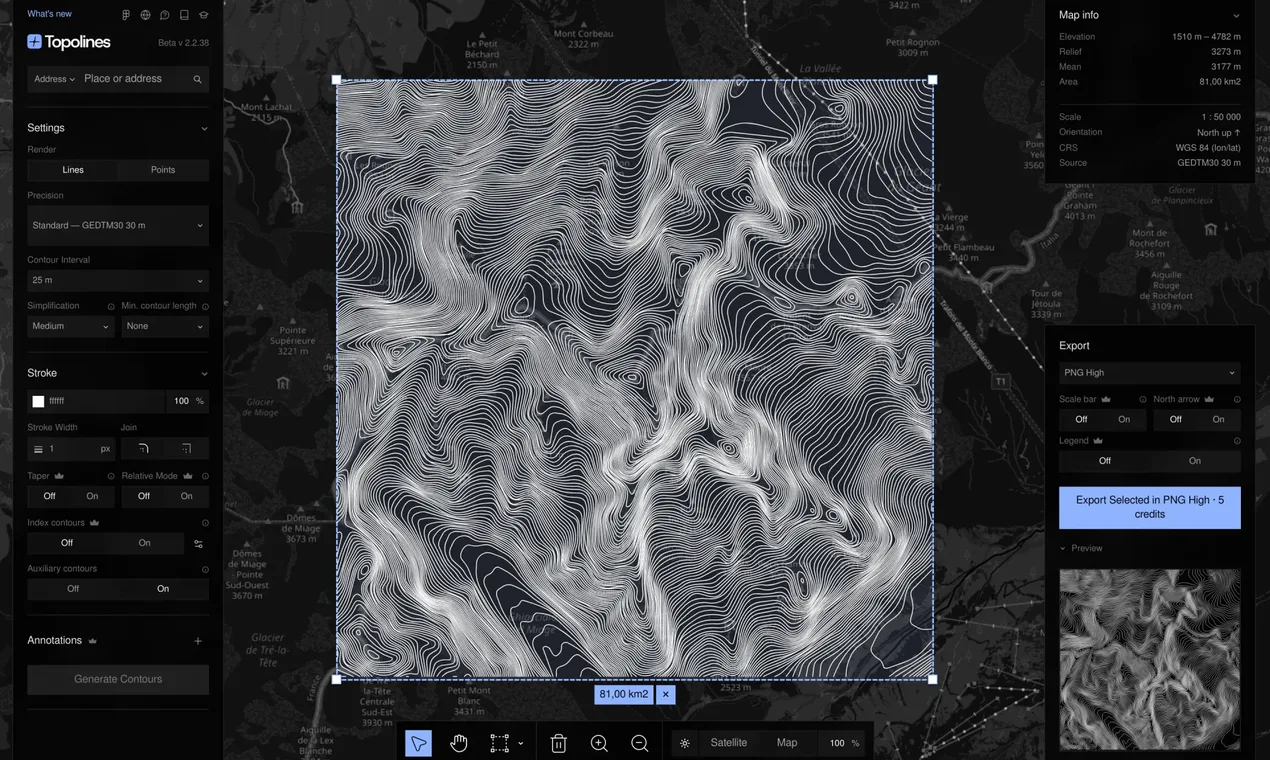
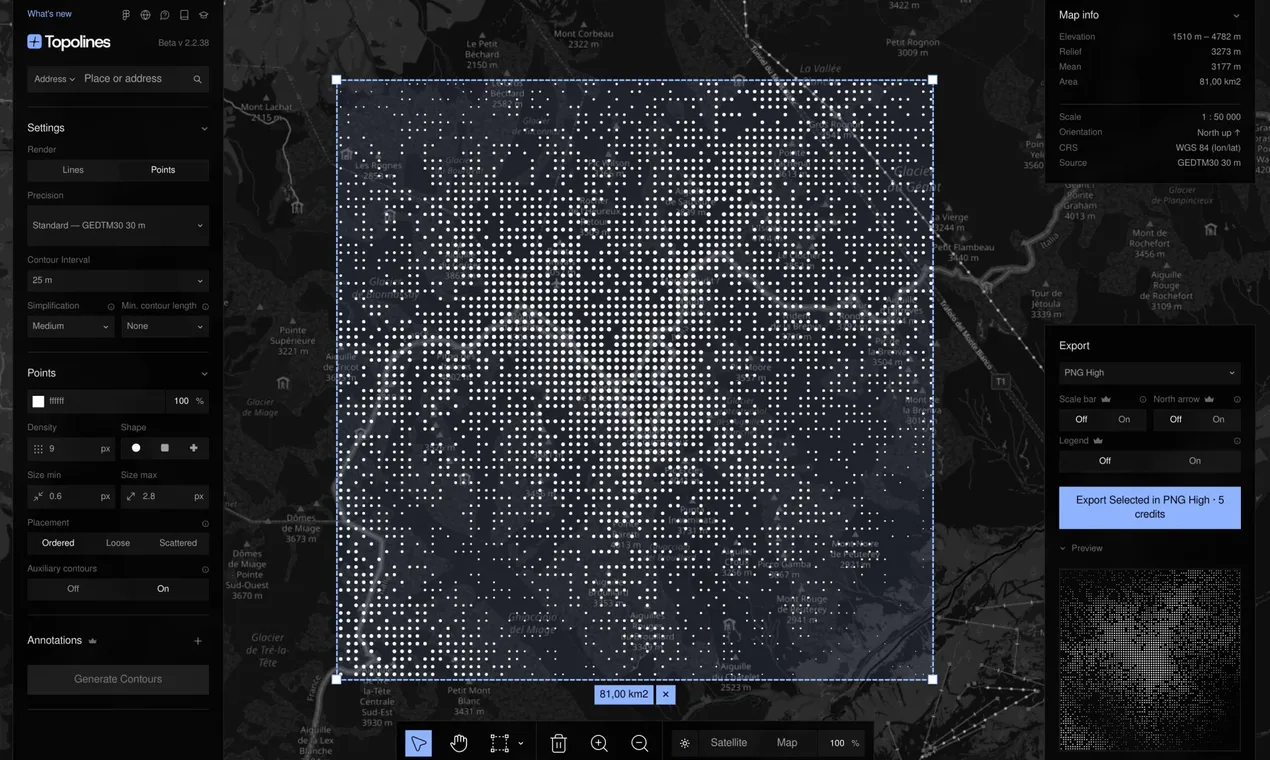
What you control:
- Shape — dots, squares or crosses.
- Density and min / max size, so you decide how much contrast the relief gets.
- Placement — ordered halftone grid, loose, or a hand-stippled scatter.
- Colour — a flat colour, or an elevation gradient, exactly like lines.
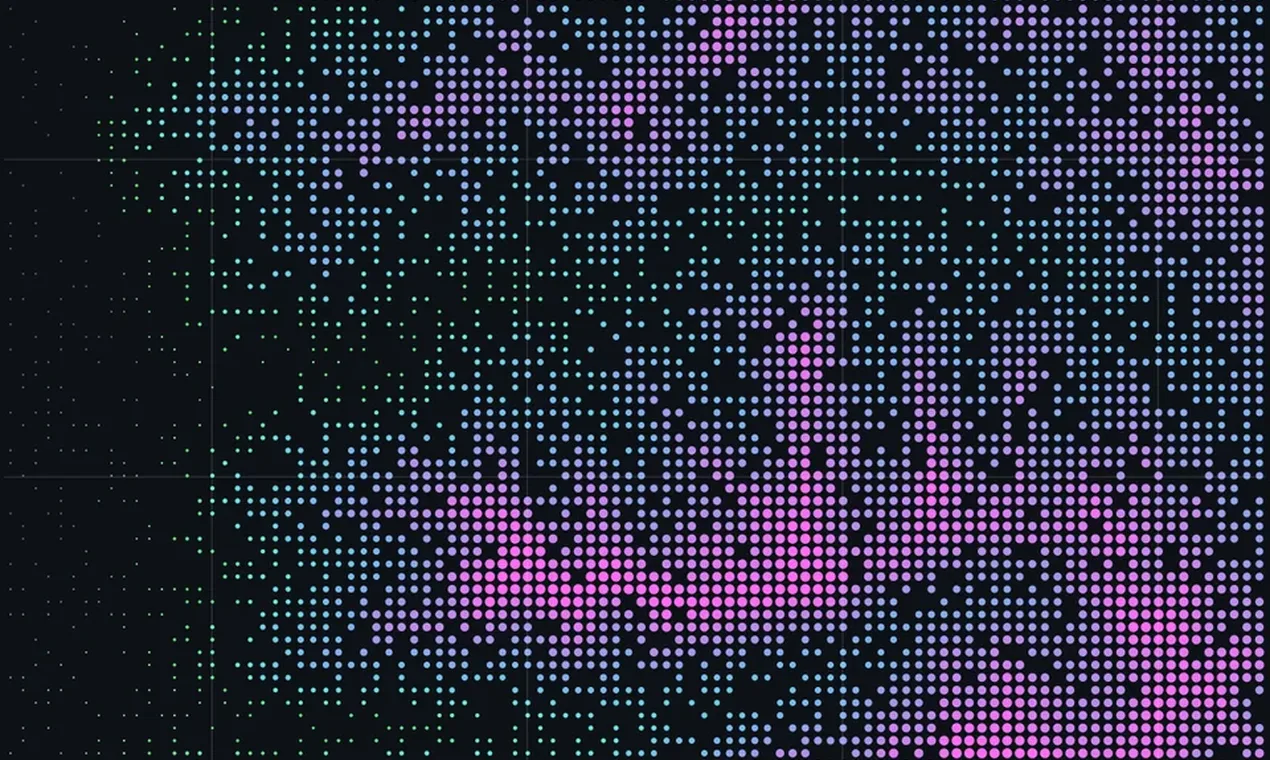
Points works like Lines: free to try, with the free PNG export, and PNG High and SVG on paid plans. The density you see in the editor is the density you get in the file, at any size.
Contour maps that read like a topo sheet
The other half of 2.0 is for people who want their contour maps to follow the conventions of a printed topographic map.
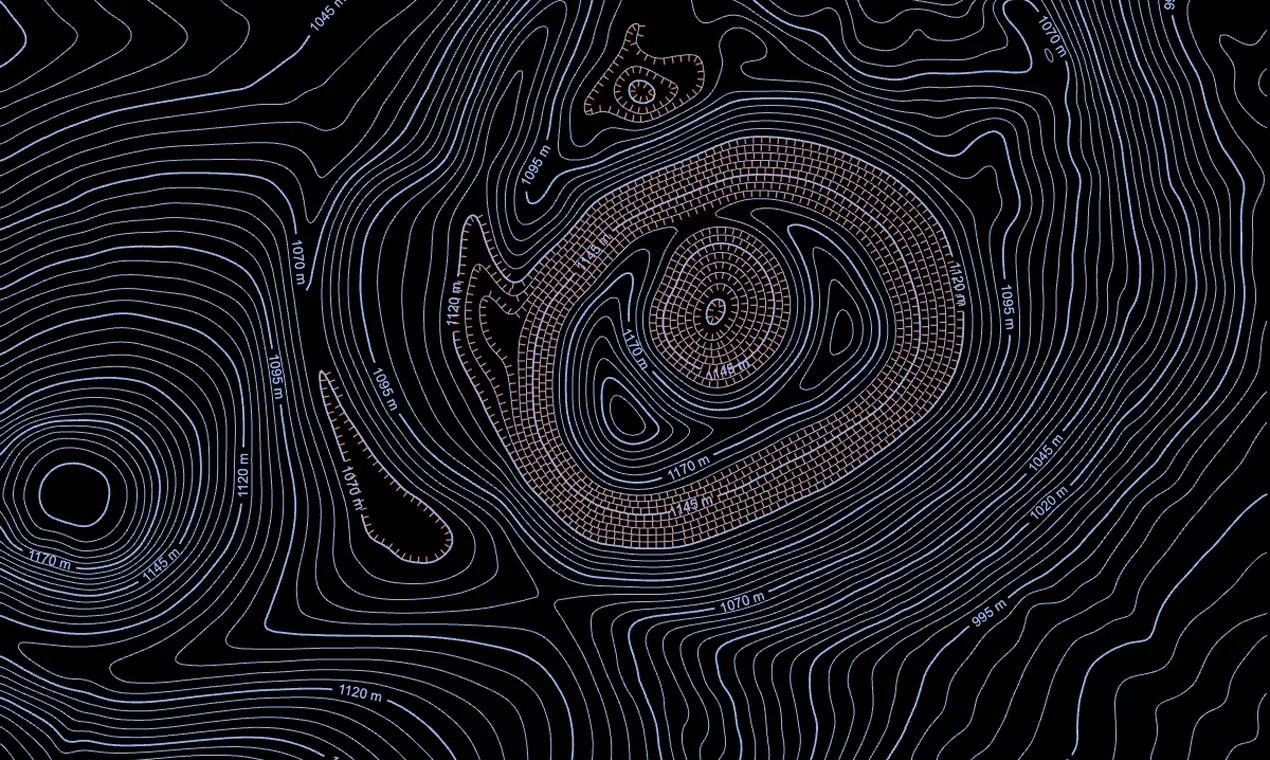
Depression contours. A closed ring around a pit or a crater now gets inward-pointing hachures, so a hole no longer reads as a hill.
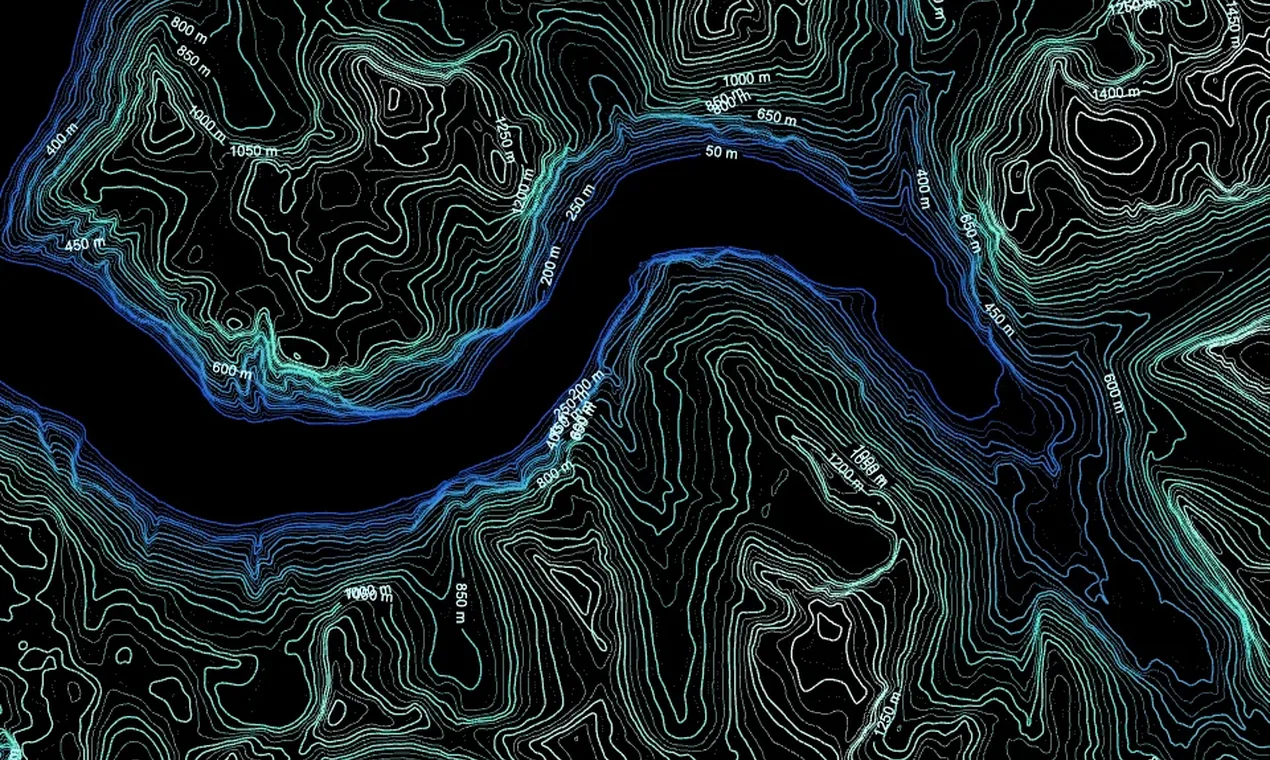
Labels that break the line. Elevation labels sit inside the contour, the line cut around them, the way a printed map does it.
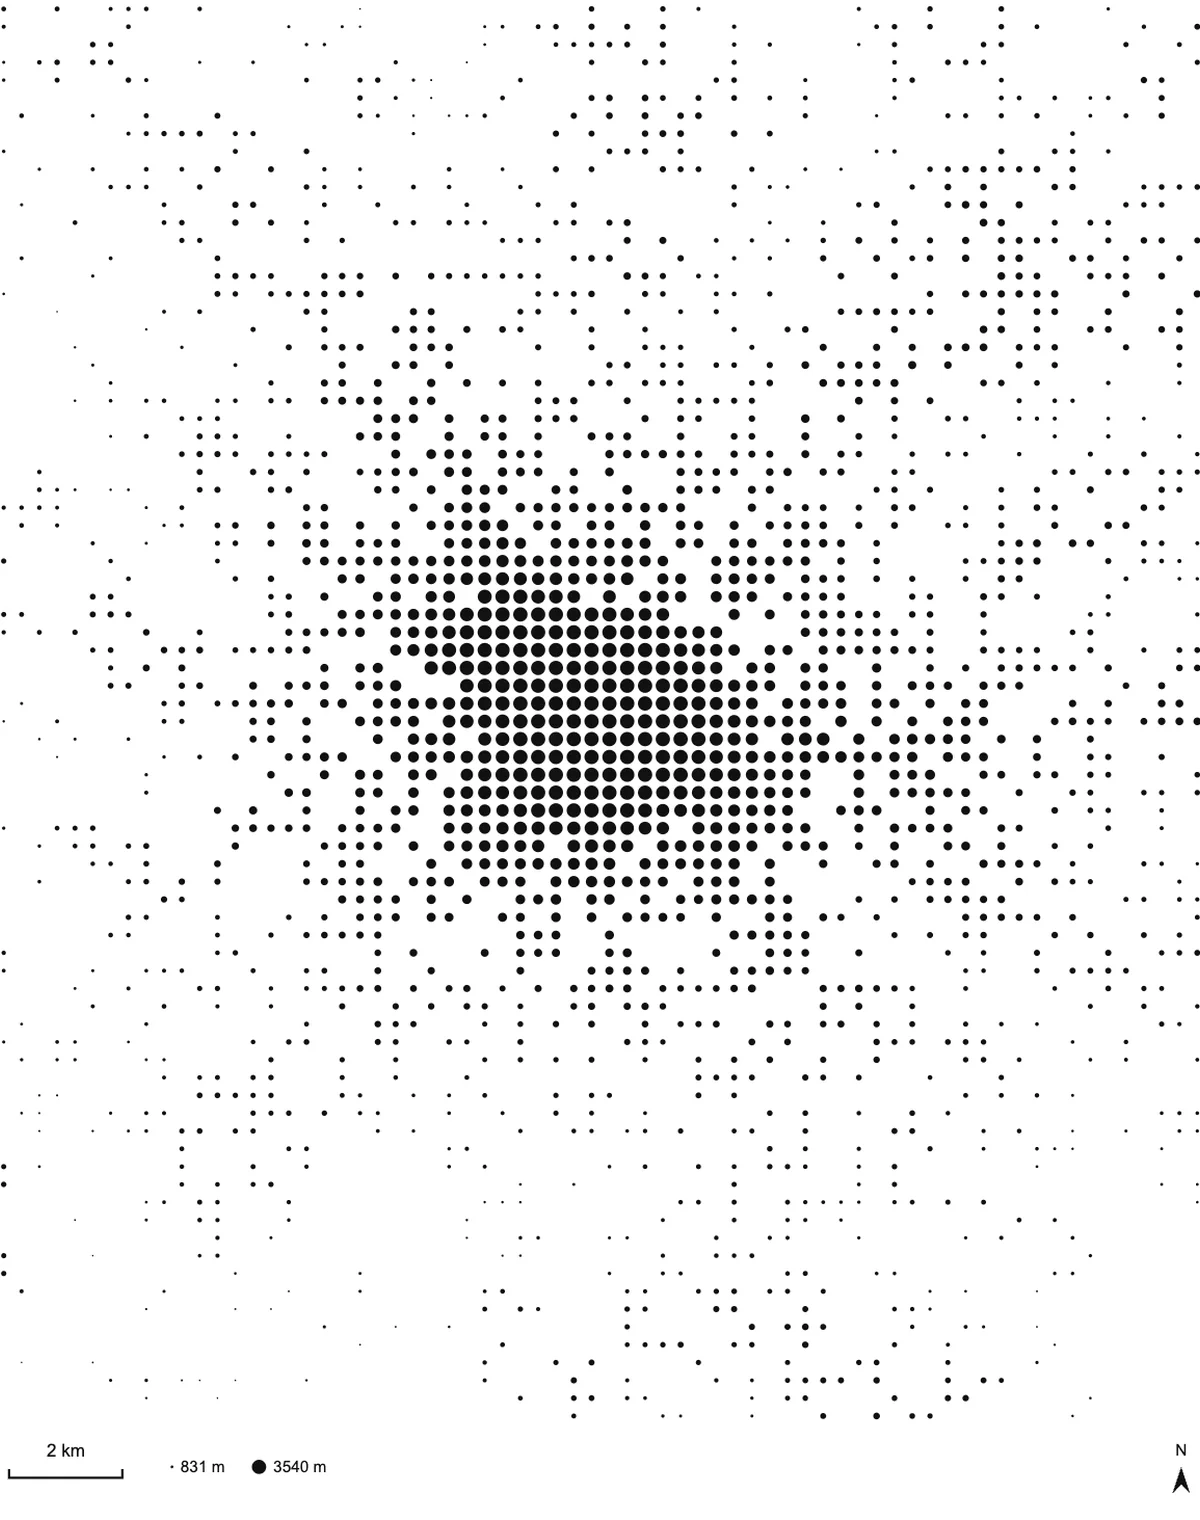
Scale bar, north arrow and legend. Drawn in a margin band below the map, never on top of the terrain, on PNG and SVG exports alike.
And a few more:
- Auxiliary contours — dashed half-interval lines that appear only on plateaus and terraces, where the regular interval would leave a blank.
- Minimum contour length — clears the tiny loops elevation noise leaves behind.
- Imhof-style gradients — two hypsometric presets in the tradition of Swiss relief maps: green lowlands, ochre slopes, grey rock, white summits.
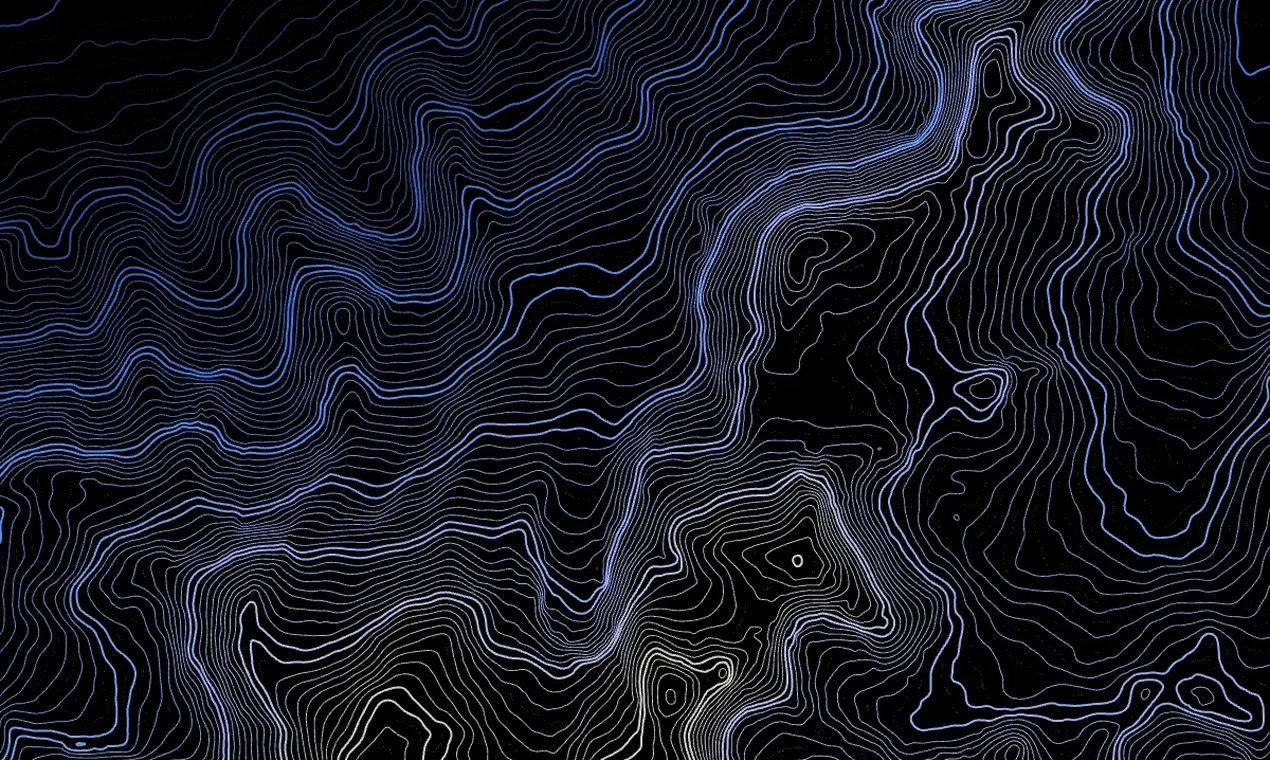
5 m lidar in five more countries
Resolution is the difference between a valley and a blur. Here is the same zone — the cliffs of the Lauterbrunnen valley, Switzerland, 10 m interval — traced twice:
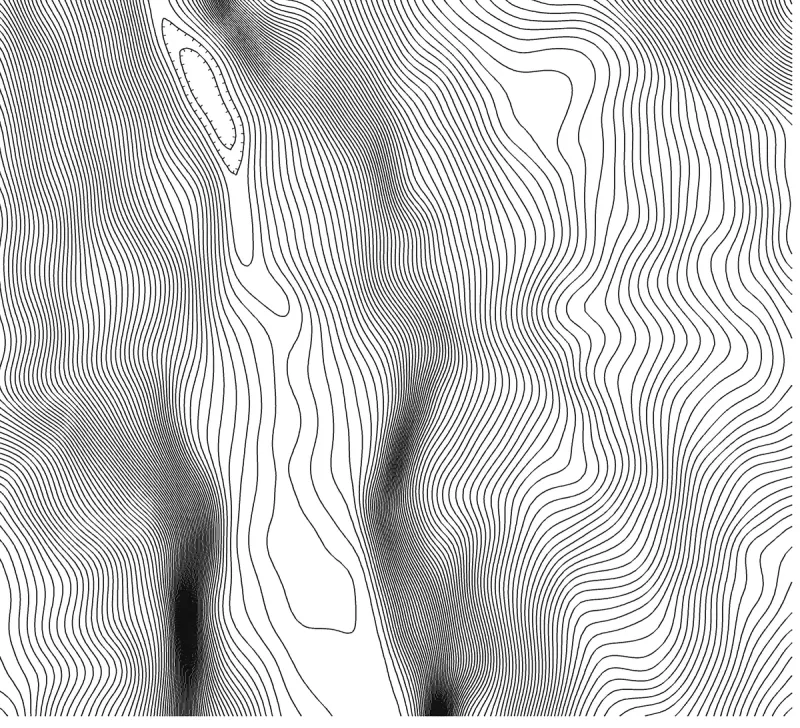
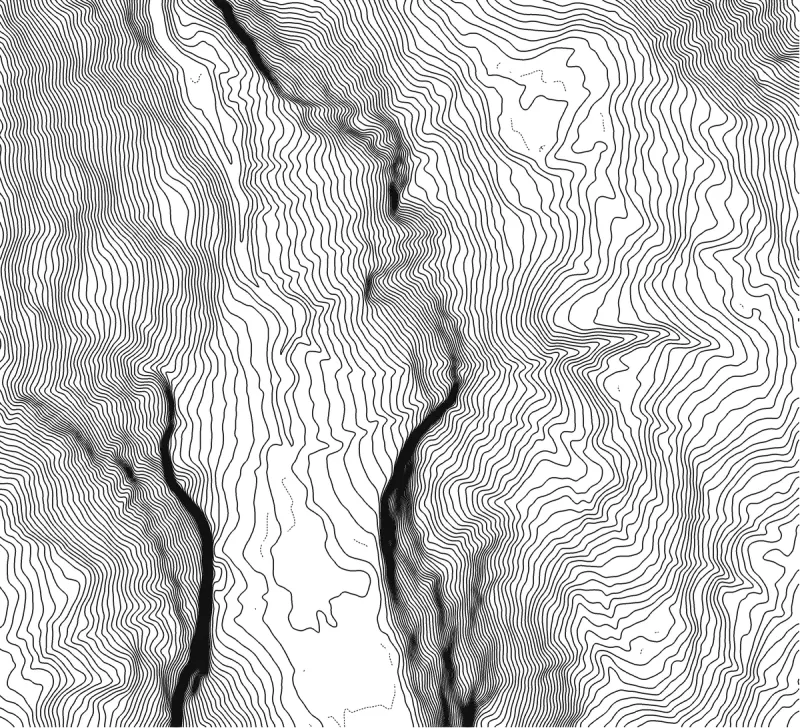
When you export in HD, TopoLines picks the best national model for your zone on its own. Since 2.0 that list includes:
 England — Environment Agency lidar, 5 m
 Austria — BEV airborne laser DTM, 5 m
 Switzerland — swisstopo swissALTI3D, 5 m
 Italy — INGV TINITALY, 10 m, Sicily and Sardinia included
 Germany — Bavaria and North Rhine-Westphalia, 5 m, more states to follow
They join  France,
 Spain and
 the United States.
Large zones now stay on the national model at a coarser grid instead of dropping
back to the worldwide source.
the United States.
Large zones now stay on the national model at a coarser grid instead of dropping
back to the worldwide source.
Straight into your design tool
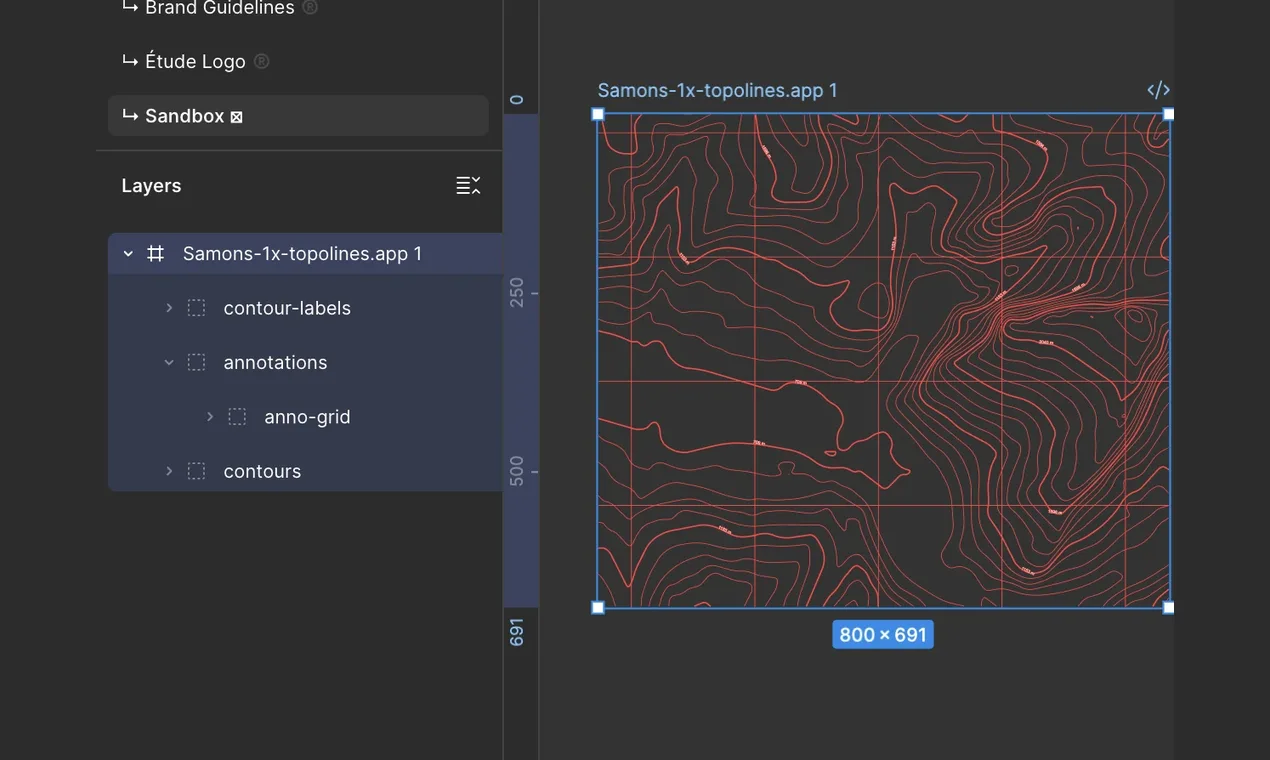
Every SVG comes out layered — contours, labels, annotations in their own groups — so it drops into Figma or Illustrator ready to restyle.
And around it
- A new basemap drawn for contour work, in light and dark: forests, rock, ice and farmland in distinct colours, soft relief shading, quiet roads, peaks, passes and huts marked with standard map symbols.
- A guided tour in chapters inside the editor, with small New tags on the new controls that disappear once you’ve used them.
- Docs and a public changelog, so you can see exactly what changed and when.
Open any zone, flip the switch from Lines to Points, and see how your terrain reads the other way. Credits you already have work for both.