To make contour lines in QGIS, load an elevation raster (a DEM), clip it to your area, then run Raster › Extraction › Contour with the interval you want. That’s the whole idea. In practice, beginners lose hours on the parts around it: finding a DEM in the first place, coordinate systems, a black border around the clipped raster, contours that look jagged, and getting the result out as a clean vector file.
This guide walks through every step in QGIS, including the ones most tutorials skip. At the end there’s a shorter route, if all you need is the contour lines themselves.
Skip QGIS: make contour lines in your browser →
What you need before you start
- QGIS, free from qgis.org. The menu paths below are the ones in recent releases; they have barely moved in years.
- A DEM (digital elevation model): a raster where each pixel stores a height. Contour lines are traced from it, so its quality sets the quality of your map.
- The area you care about, ideally as a polygon (a park, a parcel, a watershed), or just a rough rectangle.
If you’re new to contours, what is a contour map explains intervals, index lines and how to read them.
Step 1: Get a DEM for your area
This is where most beginner tutorials fall short: they hand you a file for one city, usually in the US, and the course stops working the moment you want your own place. Here’s where elevation data actually comes from:
| Source | Coverage | Resolution | Notes |
|---|---|---|---|
| OpenTopography | Worldwide | 30 m (Copernicus GLO-30, SRTM) and lidar where available | Free account; there’s also a QGIS plugin to download a DEM for the map view |
| USGS National Map | United States | 1 m to 30 m (3DEP) | Free, tile-based downloads |
| National mapping agencies | Their country | Often 1 to 5 m lidar | France (IGN RGE ALTI), England (Environment Agency), Spain (IGN), and more; formats vary |
| Copernicus DEM | Worldwide | 30 m and 90 m | Surface model: includes trees and buildings |
Two things to check before downloading:
- Terrain model (DTM) or surface model (DSM)? A surface model includes trees and buildings, so forests and cities show up as fake bumps in your contours. For contour lines you want bare earth. We compared both kinds in GEDTM30 vs lidar.
- File size. A 1 m lidar tile for a single city can weigh several gigabytes. Download only the tiles that cover your area.
Then load it: Layer › Add Layer › Add Raster Layer, pick the .tif, and
click Add. You should see a grey image, darker where it’s low and lighter
where it’s high.
Step 2: Check the coordinate system (CRS)
QGIS shows the project CRS in the bottom-right corner of the window, and each layer has its own CRS in Layer Properties › Source. Most beginner problems with layers that vanish or land in the wrong place come from here.
- Layers can have different CRSs. QGIS reprojects them on the fly, so they still line up on screen as long as each layer’s CRS is declared correctly.
- If a layer lands in the wrong place, its CRS is wrong, not the project’s.
Right-click the layer › Layer CRS › Set Layer CRS and pick the one the
data was published in (often
EPSG:4326for latitude/longitude files). - For terrain work, use a projected CRS in metres. Many global DEMs come in
EPSG:4326, where horizontal units are degrees. Contours still work (the interval is in elevation units), but hillshades and slopes come out wrong. Reproject the DEM with Raster › Projections › Warp (Reproject) to the UTM zone of your area or your national grid. EPSG:3857(Web Mercator) is what web basemaps use. It’s fine for display, but not what you want for measuring.
Can’t find a CRS in the list? Type its code (for example 3857) in the
Filter box of the CRS selector instead of scrolling through Recently Used.
Step 3: Clip the DEM to your area
Tracing contours over a whole tile is slow and produces a huge file. Cut the DEM down first:
- With a polygon: select your feature, export it with right-click › Export › Save Selected Features As (GeoJSON is fine), then run Raster › Extraction › Clip Raster by Mask Layer with the DEM as input and the new polygon as mask.
- With a rectangle: Raster › Extraction › Clip Raster by Extent, and draw the extent on the map canvas. No polygon needed.
Getting a black border around the clipped area? Those are pixels outside
the mask with no value declared as “no data”. In the clip dialog, set
Assign a specified nodata value to output bands (for example -9999) and
run it again. For a raster you already have, add the value under Layer
Properties › Transparency › Additional no data value.
Step 4: Generate the contour lines
Open Raster › Extraction › Contour (it’s GDAL’s contour tool, also in the Processing Toolbox under GDAL › Raster extraction):
- Input layer: your clipped DEM.
- Interval between contour lines: the height step between two lines, in the DEM’s elevation units (usually metres). This is the setting that matters most, and most tutorials leave it at the default 10.
- Attribute name: keep
ELEV. Every line stores its height there, and you’ll use it for styling and labels. - Offset from zero: leave at 0, so lines fall on round numbers.
Click Run. You get a new vector layer with one line per elevation.
Choosing the interval
There’s no universal value. It depends on how much relief the area has and the scale you’ll print at:
- Flat land, parks, building sites: 0.5 to 2 m, and only with a lidar DEM. A 30 m DEM can’t support a 1 m interval: you’d be drawing noise.
- Hills, a town, a valley: 5 to 10 m.
- Mountains, a whole range: 20 to 100 m.
A good rule: if the lines merge into solid black when you zoom out to the size you’ll print, double the interval.
Step 5: Style the contours (index lines and labels)
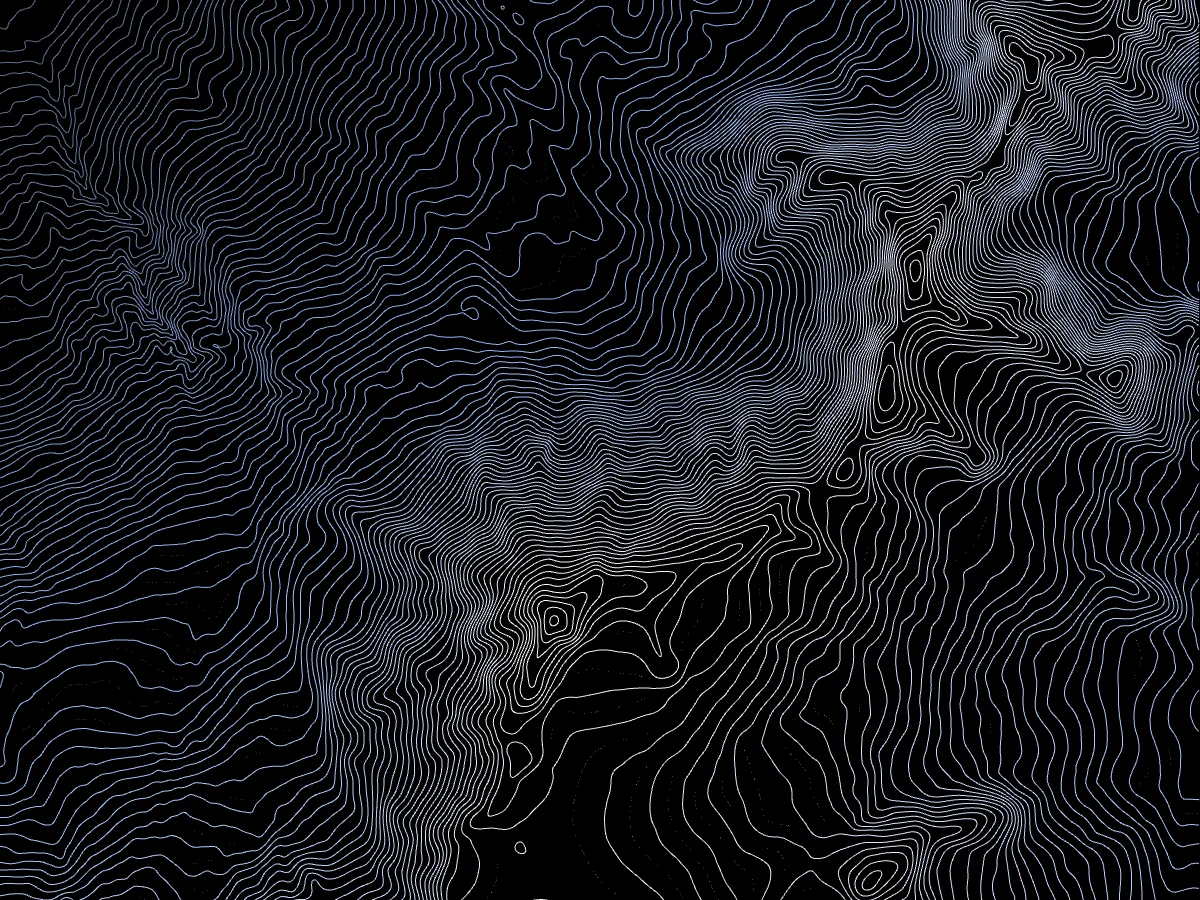
Out of the tool, every line looks the same. Topographic maps make every fifth line, the index contour, thicker and labelled. QGIS has no single button for this, but rule-based styling does it:
- Layer Properties › Symbology, switch from Single Symbol to Rule-based.
- Rule 1, the index contours: filter
"ELEV" % 50 = 0(for a 10 m interval; use five times your interval), with a thicker line. - Rule 2, everything else: filter
ELSE, thinner line. - Labels › Single labels, value
ELEV, placement Curved, and add the same"ELEV" % 50 = 0filter under Rendering › Data defined › Show label so only index lines get numbers.
Want a colour ramp from low to high instead? Use Graduated on ELEV and
pick a ramp.
Step 6: Smooth jagged contours
Contours traced from a coarse DEM look stair-stepped, because they follow the pixel grid. Two ways to fix it:
- Smooth the lines: Processing Toolbox › Vector geometry › Smooth. Keep the iterations low (1 to 3). Too much smoothing can make neighbouring lines cross, which never happens on real terrain.
- Smooth the DEM before tracing: a light blur of the raster (for example
GRASS
r.neighborswith the average method, via the Processing Toolbox) gives cleaner lines without the crossing problem. It’s more steps, but the better result.
Step 7 (optional): Add a hillshade under the lines
Raster › Analysis › Hillshade turns the DEM into a shaded relief, lit from the north-west by default. Put it under the contours with some transparency and the terrain reads at a glance. If the result looks flat or strange, the DEM is probably still in degrees: go back to step 2 and reproject it, or set the Z factor in the dialog.
Step 8: Export the contour lines
What you export depends on where the lines go next:
- For another GIS, CAD or a web map: right-click the contour layer ›
Export › Save Features As. GeoPackage or GeoJSON keep the
ELEVvalues and coordinates; DXF goes to AutoCAD or a laser cutter. - For Illustrator, Figma or Inkscape (SVG): go through a print layout. Project › New Print Layout, use Add Map to draw the map frame, then Layout › Export as SVG. In the export dialog, tick Export map layers as SVG groups so each layer gets its own group in the design tool, and Always export as vectors so nothing is rasterised.
An SVG from a print layout is in page coordinates, not geographic ones: good for design and print, useless for GIS. Keep a GeoPackage copy too.
The short version: contour lines without QGIS
QGIS is the right tool when contours are one input to a larger analysis: combining them with your own survey data, computing volumes or watersheds, or working offline on a large project.
But if what you need is the contour lines themselves, as an image or a vector file, steps 1 to 8 are mostly overhead. That’s the job TopoLines does:
- Draw your area on a world map. The elevation data is fetched for you: a worldwide bare-earth 30 m model, and 10 m or national 5 m data on Pro. No download, no tiles, no clipping.
- Pick the interval and the style. Index lines, line simplification and colours update live in the preview (contour labels are on Pro). The lines are already traced cleanly, so there’s no smoothing pass to run.
- Export as PNG, or on Pro as SVG for design tools, GeoJSON for QGIS and DXF for CAD, with the coordinate system of your choice (WGS 84, UTM, Lambert-93, Web Mercator, British National Grid).
The free plan covers areas up to 100 km² with a 30 m model, intervals of 25 m and above, and a 1024 px PNG. The exports and plans page has the details.
The two also work together: export GeoJSON from TopoLines and load it in QGIS with the elevations already in the attributes, skipping steps 1 to 6.
Make contour lines now, free →
FAQ
Why does QGIS not show my contour lines?
Check three things: the contour layer is above the DEM in the Layers panel, its CRS matches the DEM’s (right-click › Layer CRS), and the interval isn’t larger than the elevation range of your area. A 50 m interval over a park with 20 m of relief gives you zero lines.
What interval should I use for contour lines in QGIS?
Start with roughly a twentieth of the elevation range of your area, then round: 200 m of relief → 10 m interval. Never go finer than your DEM can support: about 5 m for a 30 m DEM, under 1 m only with lidar.
Can QGIS export contour lines as SVG?
Yes, through a print layout (Layout › Export as SVG), not from the layer itself. Tick Always export as vectors and Export map layers as SVG groups.
How do I get rid of the black area around a clipped DEM?
Set a nodata value when clipping (Assign a specified nodata value to output bands), or declare the existing border value in Layer Properties › Transparency.
Where can I get a DEM outside the United States?
OpenTopography and Copernicus cover the whole world at 30 m, and many countries now publish free lidar through their national mapping agency. Or skip the download: TopoLines fetches elevation data for any area you draw.