
To draw contour lines on a topographic map, you join points of equal elevation. Start from spot heights (measured elevations), estimate where each round height — 100 m, 120 m, 140 m… — falls between neighbouring points, then connect the marks of the same height with a smooth line. Repeat for every level, and the shape of the land appears.
This guide shows the hand method step by step (the one taught in geography and geology classes), how to turn contour lines into a topographic profile, and how the same job is done in AutoCAD / Civil 3D and SketchUp — or skipped entirely by generating contours from elevation data.
New to contour maps? Start with what a contour map is and how to read contour lines, then come back here to draw your own.
What you need
- Spot heights — points with a known elevation: survey points, benchmarks, a field exercise sheet, or heights read off a map. The more evenly spread they are, the better the result.
- A contour interval — the height difference between two neighbouring lines. Pick a round number that gives you 5–10 lines across the height range of your points: for points between 122 m and 234 m, an interval of 20 m gives lines at 140, 160, 180, 200 and 220 m.
- A pencil and an eraser. Contours are drawn lightly first and corrected once the overall shape makes sense.
The rules to respect while you draw
Every contour line you draw must follow the rules of contour lines. They’re also your best way to catch mistakes:
- Contour lines never cross — a point can’t be at two heights at once.
- Each line keeps one elevation all along its length.
- Every line closes on itself, or runs off the edge of the map.
- Lines never split or merge.
- Lines bend upstream when they cross a valley, forming a V that points uphill, and bend downhill around a ridge.
If two of your lines touch, or a line ends in the middle of the map, something went wrong in the interpolation.
How to draw contour lines by hand, step by step
1. Join neighbouring points into triangles
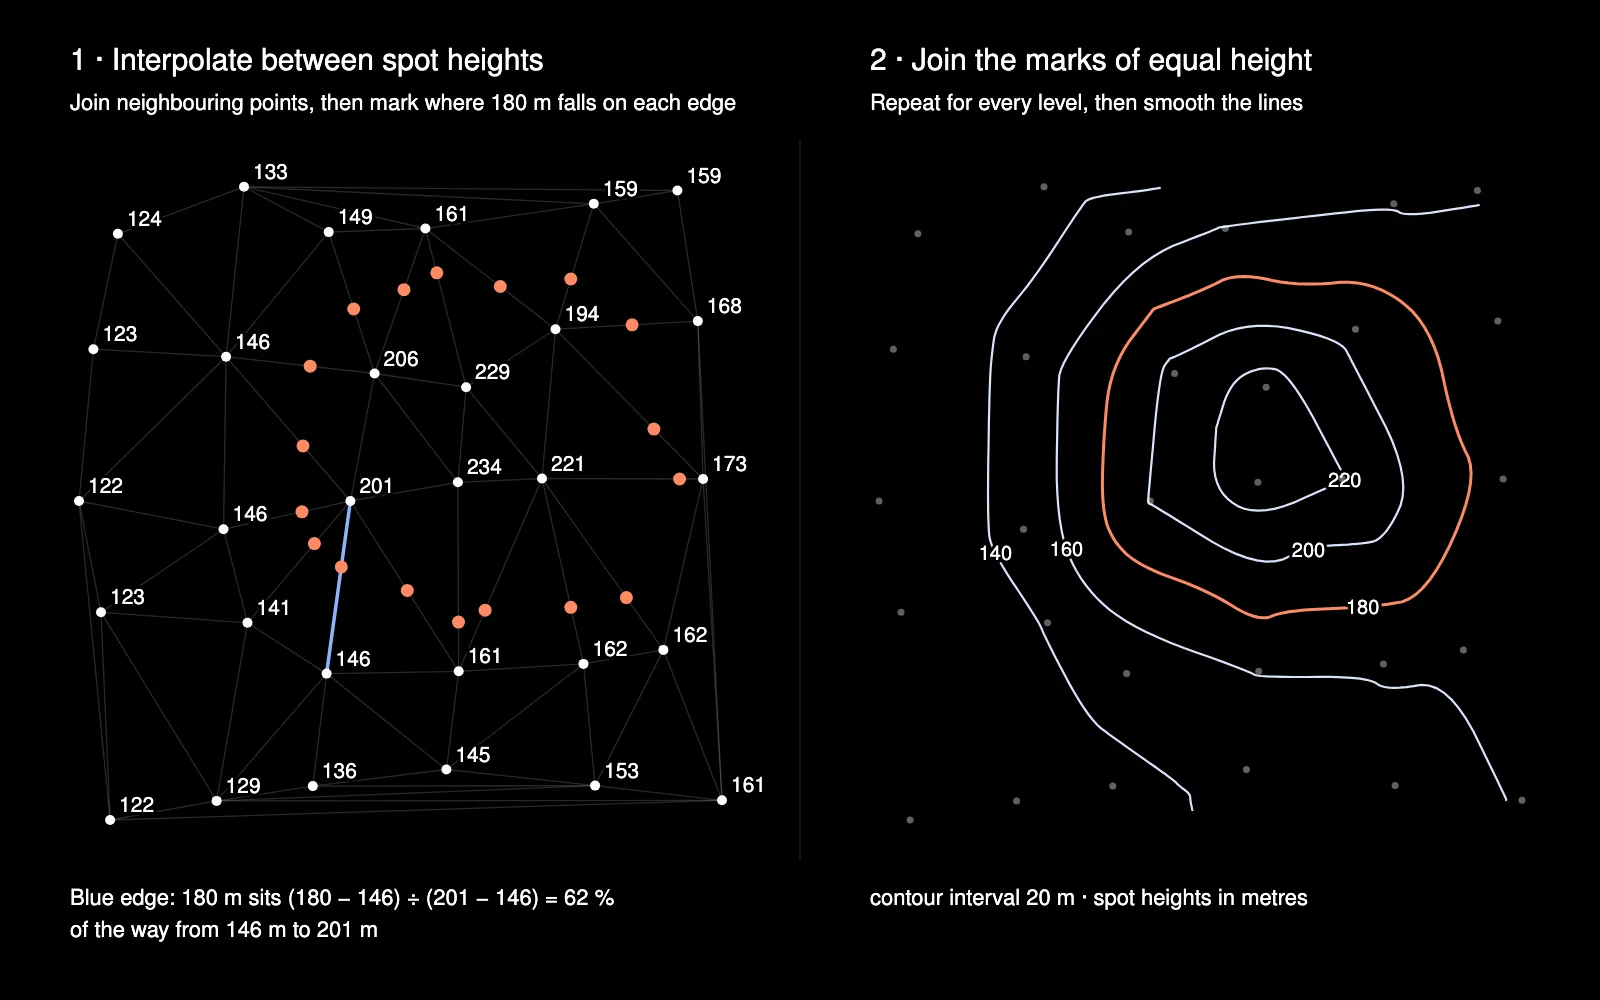
Connect each spot height to its nearest neighbours with light pencil lines, so the whole area is covered by triangles with no line crossing another. Prefer short edges and “fat” triangles over long, thin ones — you’ll only interpolate along these edges, so a long edge across a valley gives a wrong answer.
(This network is what surveyors and CAD software call a TIN, a triangulated irregular network. It’s exactly what Civil 3D builds for you further down.)
2. Interpolate along each edge
Take one level, say 180 m. For every edge whose two ends are on either side of 180 m — one below, one above — mark where 180 m falls, assuming the ground rises evenly between them:
position = (level − lower height) ÷ (higher height − lower height)
Between a point at 146 m and one at 201 m, the 180 m mark sits (180 − 146) ÷ (201 − 146) = 34 ÷ 55 ≈ 62 % of the way from the 146 m point. You can measure it with a ruler, or simply eyeball it once you get the habit: just past halfway, closer to the higher point.
Edges whose two ends are both below or both above 180 m get no mark.
3. Join the marks of the same height
Connect all the 180 m marks with one continuous line, going from triangle to triangle. In each triangle the line enters through one edge and leaves through another, so there’s only ever one way to continue. Then draw it smoothly: real ground has no corners, so round off the angles instead of joining the marks with a ruler.
4. Repeat for every level
Do the same for 140, 160, 200, 220 m, and so on. It’s faster to do one level at a time across the whole map than to finish one area first.
5. Label and check
- Make every fifth line (or every 100 m) an index contour: thicker, with its height written on it, the text reading uphill (see contour intervals and index contours).
- Check the result against the rules above, and against what you know of the terrain: rivers should sit at the bottom of V-shaped bends, summits inside the smallest closed loops.
- Where two higher and two lower points sit diagonally from each other (a saddle), the interpolation alone can’t tell you which pair to connect. Decide from the terrain — a pass between two hills, or a ridge cut by a stream — and draw it consistently for every level.
How to draw a topographic profile from contour lines
A topographic profile (or cross-section) is the side view of the ground along a line. It’s the classic second exercise once you can read and draw contours:
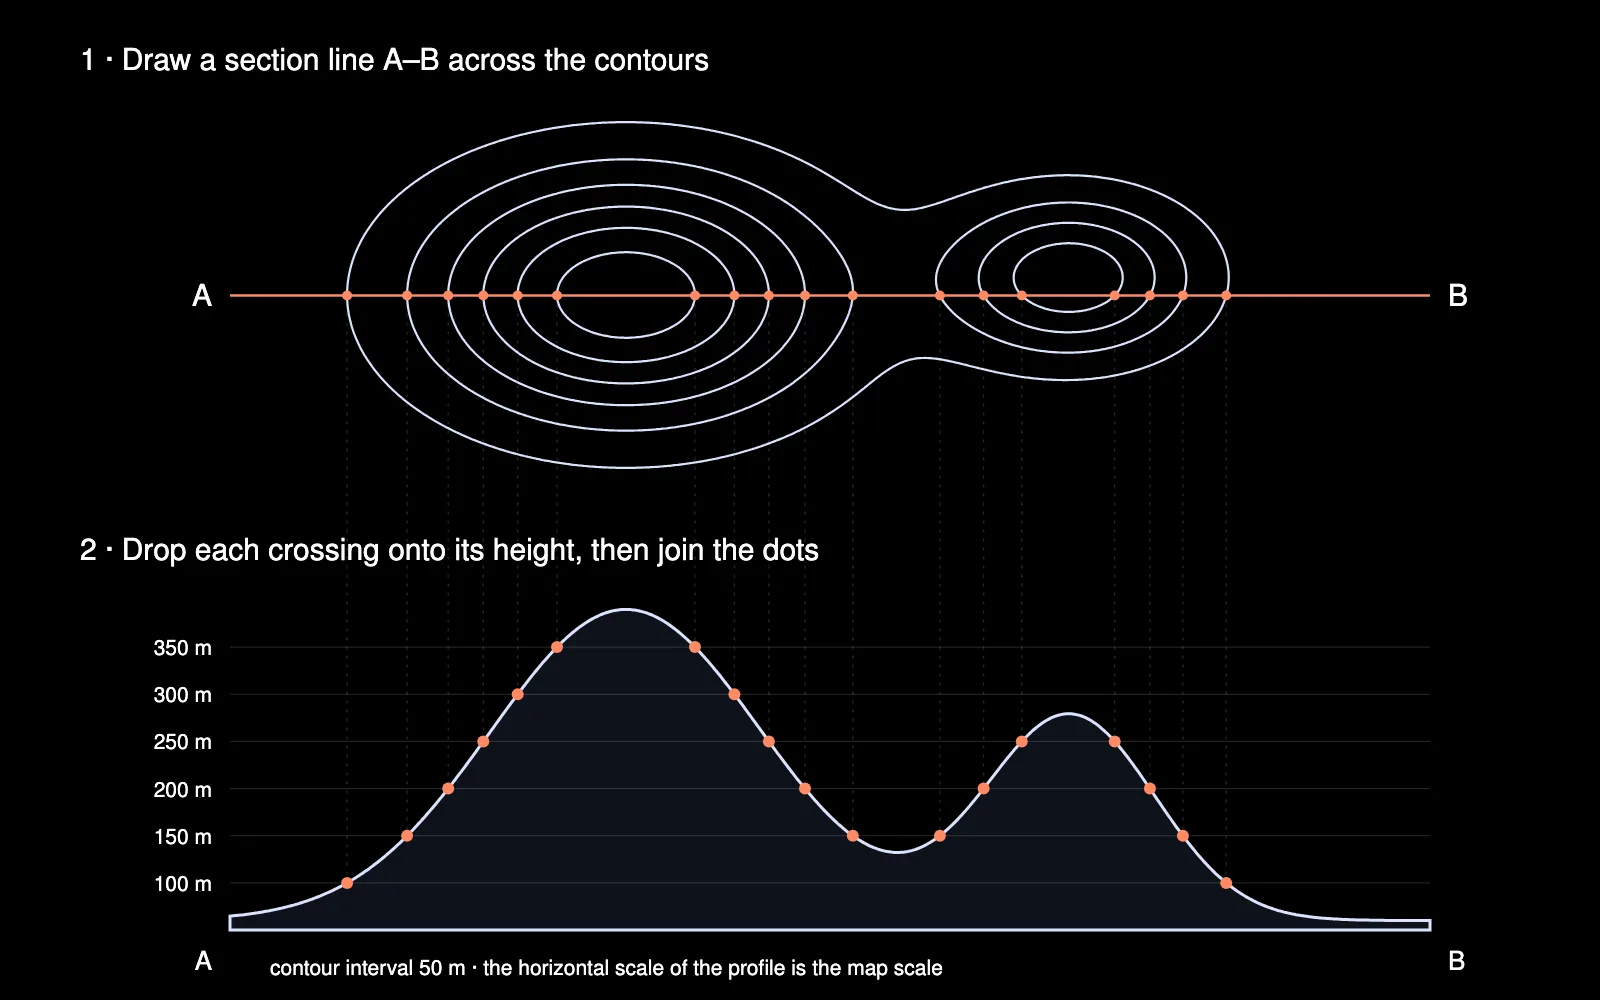
- Draw the section line A–B across the map.
- Lay a strip of paper along it and tick every place where a contour crosses the line, writing the height next to each tick.
- Draw a height grid on graph paper: the horizontal axis is the length of A–B at map scale, the vertical axis covers the heights you crossed.
- Transfer each tick onto the grid at its height.
- Join the points with a smooth line. Between two crossings of the same height (the top of a hill, the bottom of a valley), the ground goes a little higher or lower than that height — round it off rather than drawing a flat line.
If the vertical scale is larger than the horizontal one, the relief is exaggerated. That’s normal, and often necessary to see anything on gentle terrain — just write the vertical exaggeration on the profile (for example ×5).
Contour lines in geology
Geology classes use the same method on a different surface. Structure contours join points where a rock layer — the top of a coal seam, the base of a sandstone — sits at the same elevation, using heights from boreholes or outcrops instead of the ground surface. You triangulate, interpolate and join exactly as above. For a flat-lying, tilted layer, three points are enough (the classic three-point problem): the structure contours are then straight, parallel lines, and their direction gives the strike of the layer.
How to draw contour lines in AutoCAD and Civil 3D
Plain AutoCAD has no contour tool. You can trace contours by hand as polylines and set each one’s Elevation in the Properties palette, but AutoCAD won’t interpolate them for you.
Civil 3D does the whole hand method automatically:
- Import your spot heights as COGO points (Insert → Points from File, for a CSV of x, y, z).
- Create a TIN surface (Home → Surfaces → Create Surface).
- In Prospector, under the surface’s Definition, add the points as a point group — or add DEM files if you’re starting from elevation data rather than survey points.
- Set the contour interval in the surface style (Surface Style → Contours: minor and major interval).
- If you need plain polylines for AutoCAD users, use Extract Objects from the surface.
If you already have contour lines — for example a DXF exported from a contour generator — add them under Definition → Contours and Civil 3D builds the surface from them instead.
SketchUp and Google Earth
- SketchUp works the other way round: its Sandbox tool From Contours turns contour lines into a terrain mesh. The lines need to sit at their real heights first, so import 3D contours (a DXF where every line carries its elevation) rather than flat 2D lines.
- Google Earth doesn’t draw contour lines. In Google Earth Pro, you can draw a path and use Show Elevation Profile to get the profile along it, but for the contours themselves you need to generate them elsewhere and import them as an overlay.
Or generate them from elevation data
Drawing contours by hand is the best way to understand them. But for a real place, the elevations already exist: digital elevation models (DEMs) cover the whole world at 30 m resolution, and many countries publish 1–10 m lidar data. Contour software runs the same interpolation as above on millions of points instead of thirty.
- In QGIS, it’s the GDAL Contour tool on a DEM — see how to make contour lines in QGIS.
- Without any software, the TopoLines contour map generator does it in the browser: draw a zone anywhere, pick an interval and index contours, and export a PNG for free. With credits you also get labels, 5 m and 10 m downloads and vector exports: SVG, DXF (every line carries its elevation, ready for Civil 3D or SketchUp) and GeoJSON.
It won’t replace a land survey for construction work, but it gives you accurate terrain for planning, teaching, hiking maps and design.
FAQ
How do you draw contour lines step by step? Join neighbouring spot heights into triangles, mark where each round height (for example every 20 m) falls along each edge by interpolation, connect the marks of the same height with a smooth line, then label every fifth line as an index contour.
How do you draw contour lines from spot heights? By linear interpolation between neighbouring points. The level sits at (level − lower height) ÷ (higher height − lower height) of the distance from the lower point. Between 146 m and 201 m, the 180 m line passes 62 % of the way from the 146 m point.
What are the 5 rules of contour lines? Contour lines never cross; each line has a single elevation; every line closes on itself or leaves the map; lines never split or merge; and lines form a V pointing uphill in valleys and downhill on ridges.
What contour interval should I use? A round number that gives 5–10 lines across the height range of your area: 1–5 m on flat ground, 10–20 m on hills, 50–100 m in mountains. Never finer than your data supports: about 3.3 times its vertical error, as explained in how to choose a contour interval.
How do you draw a topographic profile? Draw a line A–B across the contours, mark where it crosses each contour and at what height, transfer those points onto a height grid, and join them with a smooth line.
How do you draw contour lines in AutoCAD? Plain AutoCAD can only trace them by hand as polylines with an elevation. Civil 3D generates them: import the points, create a TIN surface, and set the contour interval in the surface style.
Can you draw contour lines in Google Earth? Not natively. Google Earth Pro can show the elevation profile along a path, but contour lines have to be generated in another tool and imported.
Skip the pencil: contour lines for any place, from real elevation data. Start free →