Every free TopoLines map is traced from GEDTM30, a worldwide 30 m terrain model published openly by OpenGeoHub. Before making it the default, we wanted to see for ourselves what it changes on a contour map. This post shares what we found, with the limits of a small, informal test spelled out.
Surface models and terrain models
Most free worldwide elevation grids (SRTM, ALOS AW3D30, Copernicus GLO-30) are surface models: they measure the top of whatever stands on the ground. Over a forest that is the canopy, over a city the rooftops. Contour lines traced from them climb over every wood and every block of flats.
A terrain model (DTM, or bare earth) estimates the ground underneath. GEDTM30 does this worldwide by combining several global elevation models with ground measurements from two space lasers, ICESat-2 and GEDI, using machine learning. It is the work of Yu-Feng Ho, Tom Hengl and colleagues, described in their 2025 paper in PeerJ, and it is released under CC BY 4.0. Versioned releases are distributed by OpenTopography, a publicly funded open terrain data portal; that is where TopoLines reads it from.
The GEDTM30 team validated their model at a far larger scale than we ever could. Our question was narrower, and practical: once a map goes through our contour pipeline, does the choice of model actually show?
What we did
We picked ten areas of 20 to 120 km²: closed forest, plantations, farmland and dense city, in France, Switzerland, the United States and Brazil. For each one we traced the same contours from Copernicus GLO-30 (surface) and GEDTM30 (bare earth), with exactly the smoothing used in production. Where a national lidar terrain model exists (IGN RGE ALTI, swissALTI3D, USGS 3DEP), we used it as the ground truth. Lidar, flown from aircraft, sees through gaps in the leaves and is accurate to a few decimetres.
To keep ourselves honest, we fixed the list of sites before each run and kept every result, including the ones that don’t flatter GEDTM30.
What we found
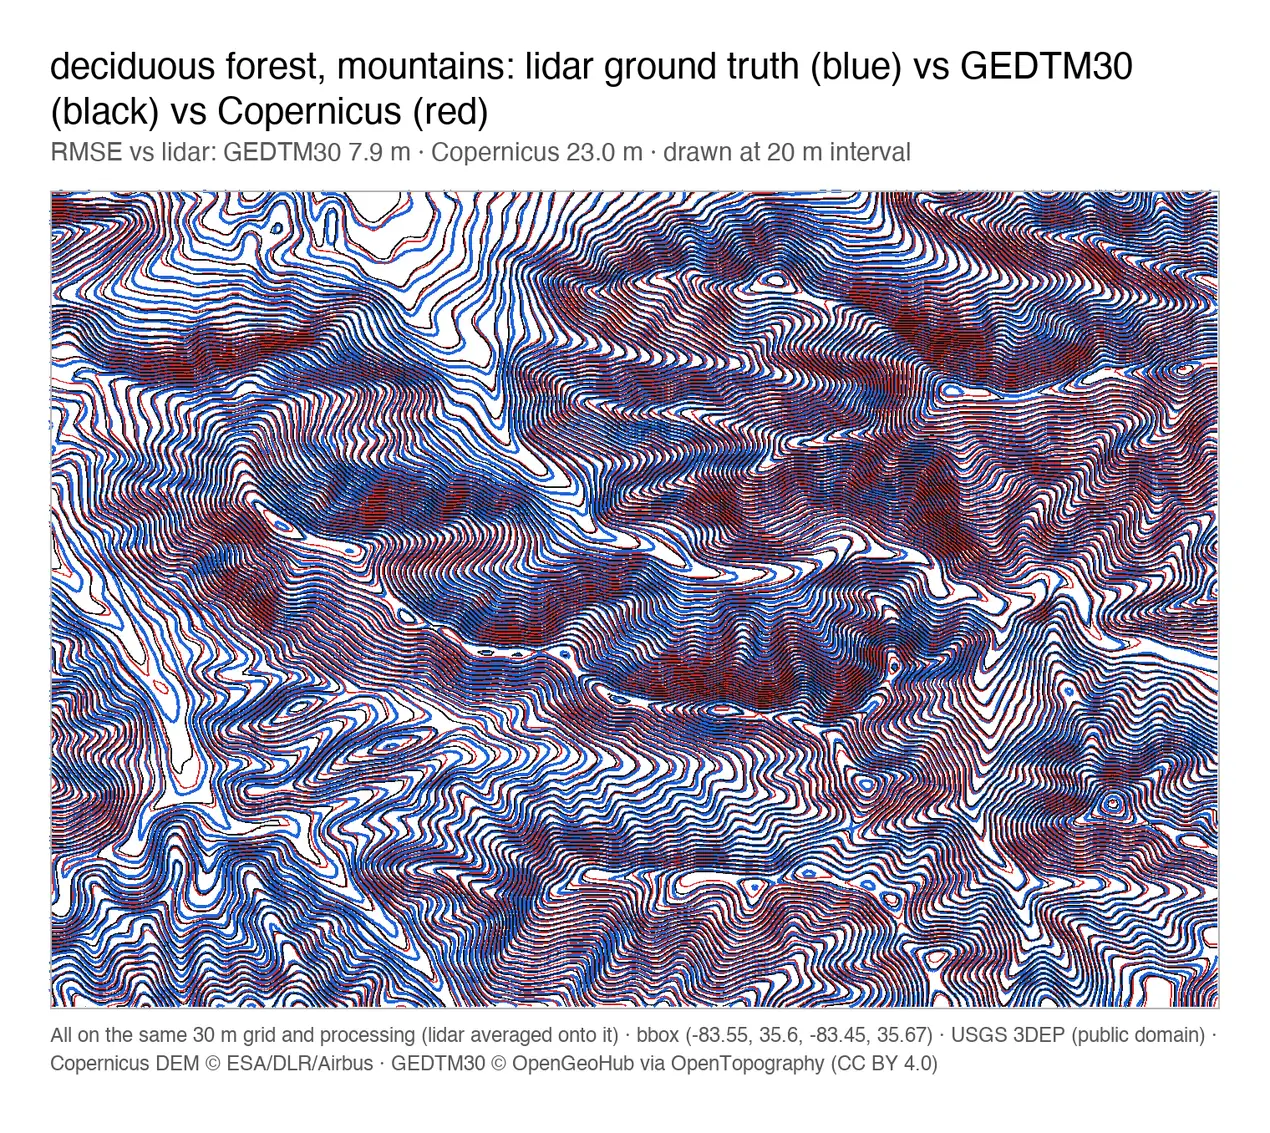
The shape of the contours barely changes. After smoothing, the total length of contour lines differed by 11 % at most between the two models (2 % typically). The canopy’s texture mostly disappears; what remains is a vertical offset.
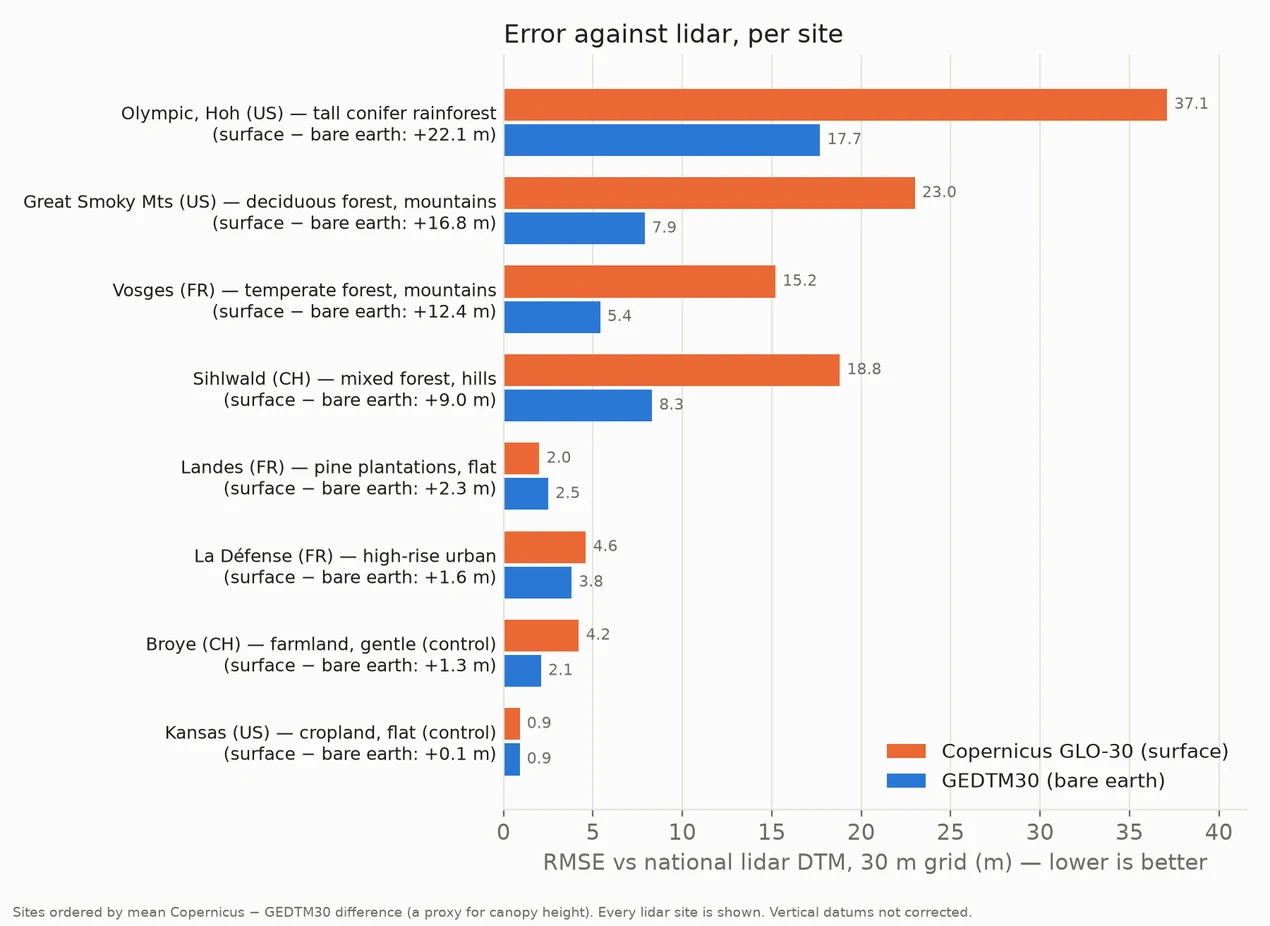
Under forest, that offset is large, and GEDTM30 removes most of it. At the four forested lidar sites, its error was a half to a third of Copernicus’s:
| Site | Cover | Copernicus | GEDTM30 |
|---|---|---|---|
| Olympic, Washington (US) | tall conifer rainforest | 37.1 m | 17.7 m |
| Great Smoky Mountains (US) | deciduous forest | 23.0 m | 7.9 m |
| Sihlwald (CH) | mixed forest | 18.8 m | 8.3 m |
| Vosges (FR) | mountain forest | 15.2 m | 5.4 m |
| La Défense (FR) | high-rise city | 4.6 m | 3.8 m |
| Broye (CH) | farmland | 4.2 m | 2.1 m |
| Landes (FR) | pine plantations | 2.0 m | 2.5 m |
| Kansas (US) | cropland | 0.9 m | 0.9 m |
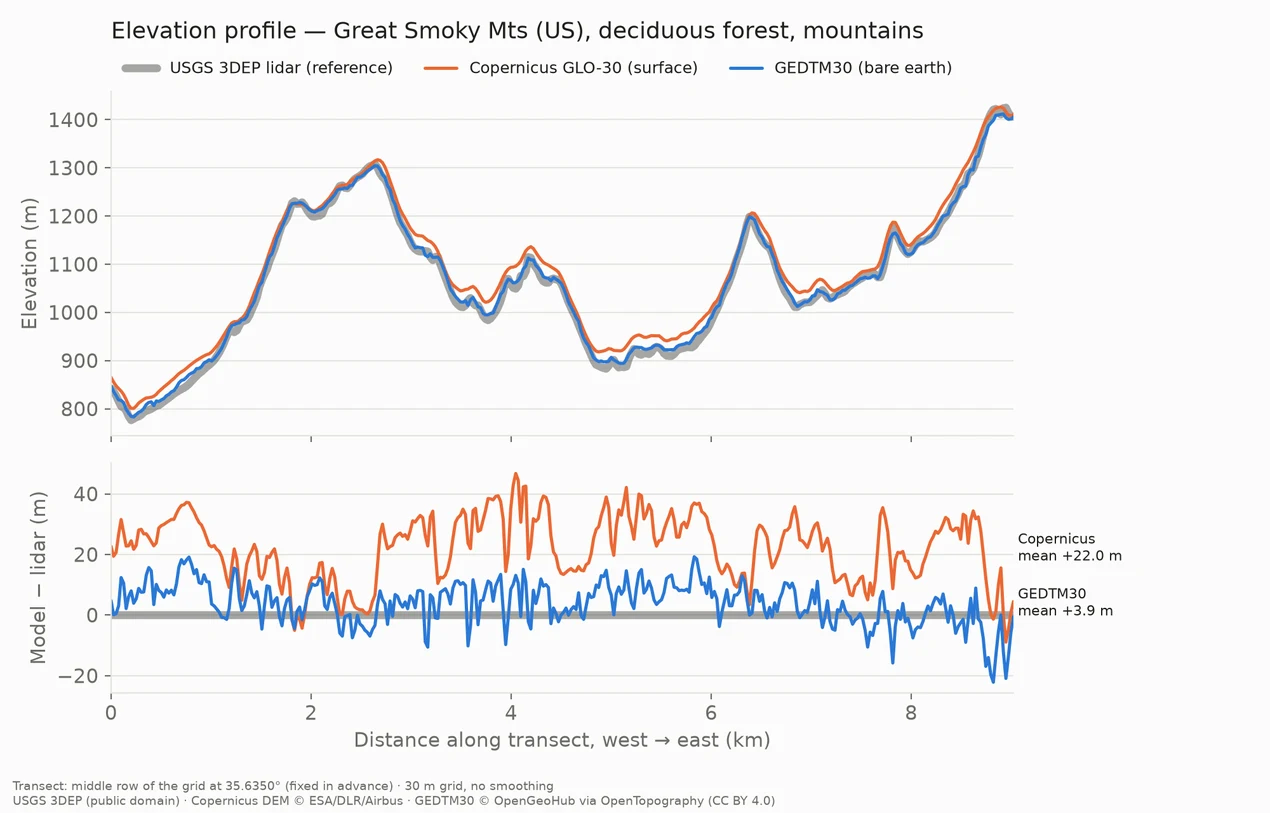
Along a 9 km line across the Great Smoky Mountains, Copernicus sits on average 22 m above the lidar ground, roughly the height of the canopy. GEDTM30 sits about 4 m above it.
On the map, that means contour lines that sit where the ground is, not 20 m up in the trees:
In open country the two are close. On farmland and in the city both models stay within a few metres of the lidar. In the Landes plantations Copernicus was slightly better, by half a metre.
No 30 m model is perfect. Under the tallest forest, GEDTM30 still sat about 11 m too high in the Olympic rainforest and 5 m in Sihlwald. And at a 5 or 10 m interval, even the better model puts a good share of contour lines one step off. For maps that need every line exact, a national lidar model is the right tool; HD exports use one wherever we have it (see Datasets).
How far this goes
This is a small check, not a study: eight lidar sites picked by hand, vertical datums left uncorrected (they shift both models equally at a given site), and a single smoothing setting. It confirms, on our own maps, what the GEDTM30 authors measured on a much larger scale. If you want the real science, read their paper.
Thanks, and where to learn more
GEDTM30 exists because OpenGeoHub chose to publish it openly, and OpenTopography hosts it for anyone to use. Thanks to both, and to IGN, swisstopo and the USGS for open lidar.
If terrain models interest you beyond pretty maps, the people who build them meet at Geomorphometry 2027, in Doorwerth, the Netherlands, from 31 May to 3 June 2027.