
All maps (Lines or Points), images (PNG or SVG) and vector files (GeoJSON or DXF) in TopoLines, whether generated from the global 30 m grid or from national lidar models at 5 m, are created by the same engine. Until this month, it had no name. It was referred to as “the tracer”. Few people questioned it, as it worked well enough. We did.
We now call it the Karst Engine. This post covers what we changed, how we verified it, how it performs against the reference tools of the field, and what it still does poorly.
Why we changed it
Contour lines are measurements: each vertex states that the ground at that point stands at that exact height. These lines are used in design, on posters and laser-cut plates, and in GIS, in QGIS, AutoCAD or Rhino. In both cases they are trusted. So in November we stopped adding features and read the tracer line by line, to find the places where its lines say something the data doesn’t.
We found 8 issues, 4 of which were significant.
Simplification varied with direction. The tolerance in metres was converted into degrees of longitude, then applied to both axes. At 45° N, a line could therefore move 1.41× further north–south than intended; at 60° N, twice as far. In Alaska, a 15 m tolerance produced lines that moved by up to 30.6 m.
Crossing lines. Each contour was simplified on its own, so on steep ground a shortcut on one line could cut across its neighbour. In the steepest lidar zones of our test set, up to 18 pairs of lines crossed. When two contours cross, they claim the ground has two heights at the same point.
Land below sea level became sea. Any height at or below 0 m was treated as sea and dropped. In Death Valley, that was 51.9 % of the Badwater Basin zone: the −25, −50 and −75 m contours were never drawn.
Double-smoothed data. The default grid, GEDTM30, is already filtered by its authors before it ships (Ho et al., 2025). Our fixed blur smoothed it a second time, and lowered its crests by 15 to 31 m on average.
None of these issues would show on an attractive map. All of them show in a measurement.
How we improved it
Before changing any code in the engine, we built the instrument to judge it.
Terrains with known answers. A Gaussian hill, a saddle, a ridge, a valley, a tilted plane at several latitudes, a noisy steep slope, and terrain below zero. On each, the exact contours are known in advance, so errors can be measured to the millimetre. These tests run in our continuous integration on every change.
Failing tests for known issues. Each known issue became a test expected to fail, which raises an alarm if it ever passes by accident. A phase of work was done when its tests turned green.
6 real zones, 2 continents, 3 data sources. The Calanques (sea cliffs near Marseille), the Barre des Écrins (a 4,000 m summit and its glacier), the Camargue (lagoons at sea level), Badwater Basin in Death Valley (−85 m), the Zuidplaspolder (reclaimed land below sea level, Netherlands) and Girdwood, Alaska (60.96° N). Each zone was traced from GEDTM30 and, where available, from IGN RGE ALTI or USGS 3DEP lidar at 5 m. Each was measured the same way before and after every phase: crossing lines, self-intersections, the largest displacement on each axis, vertical error, vertex count, time and memory.
The work was done in 4 phases, each on its own branch, each compared before and after on the same zones.
What Karst does differently
A tolerance in ground metres, the same in every direction. All distances are computed on a local metric scale at the zone’s latitude. At Girdwood, Medium now moves a line by 15.0 m at most, as intended. The bound is guaranteed by the Douglas–Peucker algorithm (Douglas & Peucker, 1973), and the benchmark measured it at every latitude from 36° N to 61° N.
All lines simplified in one go. All the contours of a zone, and the coastline, are passed as one geometry to the topology-preserving simplifier of GEOS. A shortcut is refused if it would cut any other line of the set, not only its own. This is the constraint of Saalfeld (1999), applied to the whole map. On our 6 zones, at every step: 0 crossing lines and 0 self-intersections, for 0 to 3 % more points.
Smoothing sized to the data. The smoothing width is set in metres on the ground, the same in both directions, and follows the cell size of the grid actually served. GEDTM30 is smoothed by a fraction of a cell; raw lidar is smoothed more. On GEDTM30, crests now lose 1.0 to 2.6 m on average (15 to 31 m before). Girdwood keeps 37 of its 75 small depressions (3 before). At the summit of the Barre des Écrins the tracer now costs 1.4 m, while GEDTM30 itself sits 75 m below the lidar there. Once again, the data, not the engine, is the main source of error. As it should be.
Below sea level is land. The sea is now identified from what it really is in the data, and everything else is traced. Badwater Basin gets its contours down to −75 m; the polder gets its own down to −10 m.
Guided simplification. A new Fine · 2 m step removes the cell-by-cell zig-zag of lidar data. On 5 m lidar it removes 85 to 93 % of the points, and no line moves by more than 2.0 m. A 5 m grid holds no detail that small, so nothing real is lost. A Recommended tag shows which step suits each zone, from the cell size, the median spacing between contours (Bayer et al., 2023; Miller, 2024) and the number of points. Auto minimum length clears the swarm of tiny loops on flat ground (1,294 down to 360 on the polder) and keeps 99 % or more of the lines in the mountains.
What we learned
Some of what the measurements showed, we didn’t expect.
The sea is not empty. We expected open water to arrive as missing cells. In GEDTM30, IGN and USGS data alike, it arrives as a perfectly flat surface at 0.0 m. Land below zero has relief; water has none. That difference is now how Karst finds the sea.
A per-line safeguard guards nothing. Turning on the usual “preserve topology” option line by line removed none of the 123 crossings of a synthetic test. A line cannot avoid a neighbour it never sees.
Flat ground is where lines are fragile. A height error h moves a contour sideways by h / tan θ. A 5 m error moves the line by 9 m on a 30° slope, and by 95 m on a 3° one. Mountains are the easy case; contours in plains, deltas and polders are delicate.
Two published methods didn’t beat the simple one. We implemented and tested the adaptive smoothing of Kettunen et al. (2017) and the feature-preserving filter of Lindsay et al. (2019). Neither did better than a well-sized Gaussian on our criteria, so neither shipped. Details in What the tracer does to a contour line.
Benchmarking Karst against GDAL and GRASS
Beating our own previous version proves little. We want to know how Karst compares with
the tools the GIS world already trusts: GDAL’s gdal_contour and GRASS GIS’s r.contour.
So we built the Open Contour Benchmark, and we built it to be hard on us.
Rules fixed in advance. The protocol was written and frozen before the first result. It opens with a conflict of interest: we build one of the 3 engines measured, so the benchmark is open and reproducible, not independent. We also read each engine’s source code and wrote down 8 predictions about how they would differ, before measuring anything.
Blind evaluation. Each output was given an anonymous ID. The table linking IDs to engines was sealed, and its SHA-256 fingerprint committed. The metrics were committed before unblinding. When GRASS failed on one input during the first run, the change to the driver was logged as a post-hoc amendment, and the failure recorded as a result.
The pilot run. 244 outputs, 20 cases: synthetic terrains at 30 m and 5 m on the equator and at 60° N, and 2 real grids, the Écrins in IGN lidar and the Zuidplaspolder in GEDTM30.
Extraction. On regular terrain, Karst draws the same contours as GDAL and GRASS, to within 3.4·10⁻⁵ of a cell. No engine produced a crossing at the extraction stage. As expected: the foundation is standard and correct.
Simplification. This is where the engines part ways. Crossing pairs between levels:
| Zone and setup | GDAL | GRASS GIS | Karst |
|---|---|---|---|
| Écrins, IGN lidar 5 m, every 10 m, simplified at 15 m | 1,765 | 1,650 | 0 |
| Écrins, every 10 m, simplified at 2 m | 95 | 80 | 0 |
| Zuidplaspolder, GEDTM30, every 1 m, simplified at 15 m | 5,079 | no output | 6 |
On the Écrins, Karst stays at 0 at every tolerance, where the per-line simplification of the other two produces hundreds to thousands of crossings.
Of our 8 predictions, 3 held, 2 partly held, 2 failed, and 1 was a plain measurement. All of them are published.
Results not in TopoLines’ favour
The protocol requires the results against TopoLines to be listed first. Here they are.
Zero crossings is a measurement, not a law. On the Dutch polder, traced every 1 m and simplified at 15 m, 6 pairs of crossing lines remained (3 already at 6 m). Far fewer than GDAL’s 5,079, but not the 0 we had predicted.
Equal values split engines. Where grid samples sit exactly on a contour level, they form a band, and engines trace opposite edges of it. Take the row 0 · 5 · 5 · 5 · 10 at level 5: GDAL draws the line between 0 and 5, Karst between 5 and 10. On grids stored in round steps, like GEDTM30’s decimetres on a flat polder, the gap can reach a kilometre. We had predicted GDAL would be the outlier. It was us.
Karst is not the fastest. GDAL extracts the same lines much faster and with less memory: 0.56 s and 70 MB, against 3.99 s and 384 MB for Karst, on the Écrins traced every 10 m. GRASS took 66 s. Karst runs in Python and pays about 0.4 s of start-up on every call: imperceptible on a map, measurable in a benchmark.
Avoiding crossings sometimes costs points. In 17 of 60 groups, Karst kept more vertices than both other engines, up to 51 % more on dense relief at a 15 m tolerance. We had predicted it in every group.
We could have left these out. But a benchmark that only shows wins is an advert, and an advert is of no value to someone who needs to trust the lines.
Ongoing work
Karst is the engine every TopoLines map is traced with today. It is also the first version of an engine we can measure, and that sets the work ahead.
Two new pieces of work, from the benchmark: the bands of equal values, and the last crossings on flat, quantised grids.
The benchmark will grow. The next version of the protocol tests sea and coastline handling, missing data and high latitudes. The repository will be published with its inputs, outputs and scripts, so that anyone can rerun it.
Longer term: filtering contours by the prominence of the relief they describe, showing how much each line can be trusted from the uncertainty of the data, and a better rule at saddles.
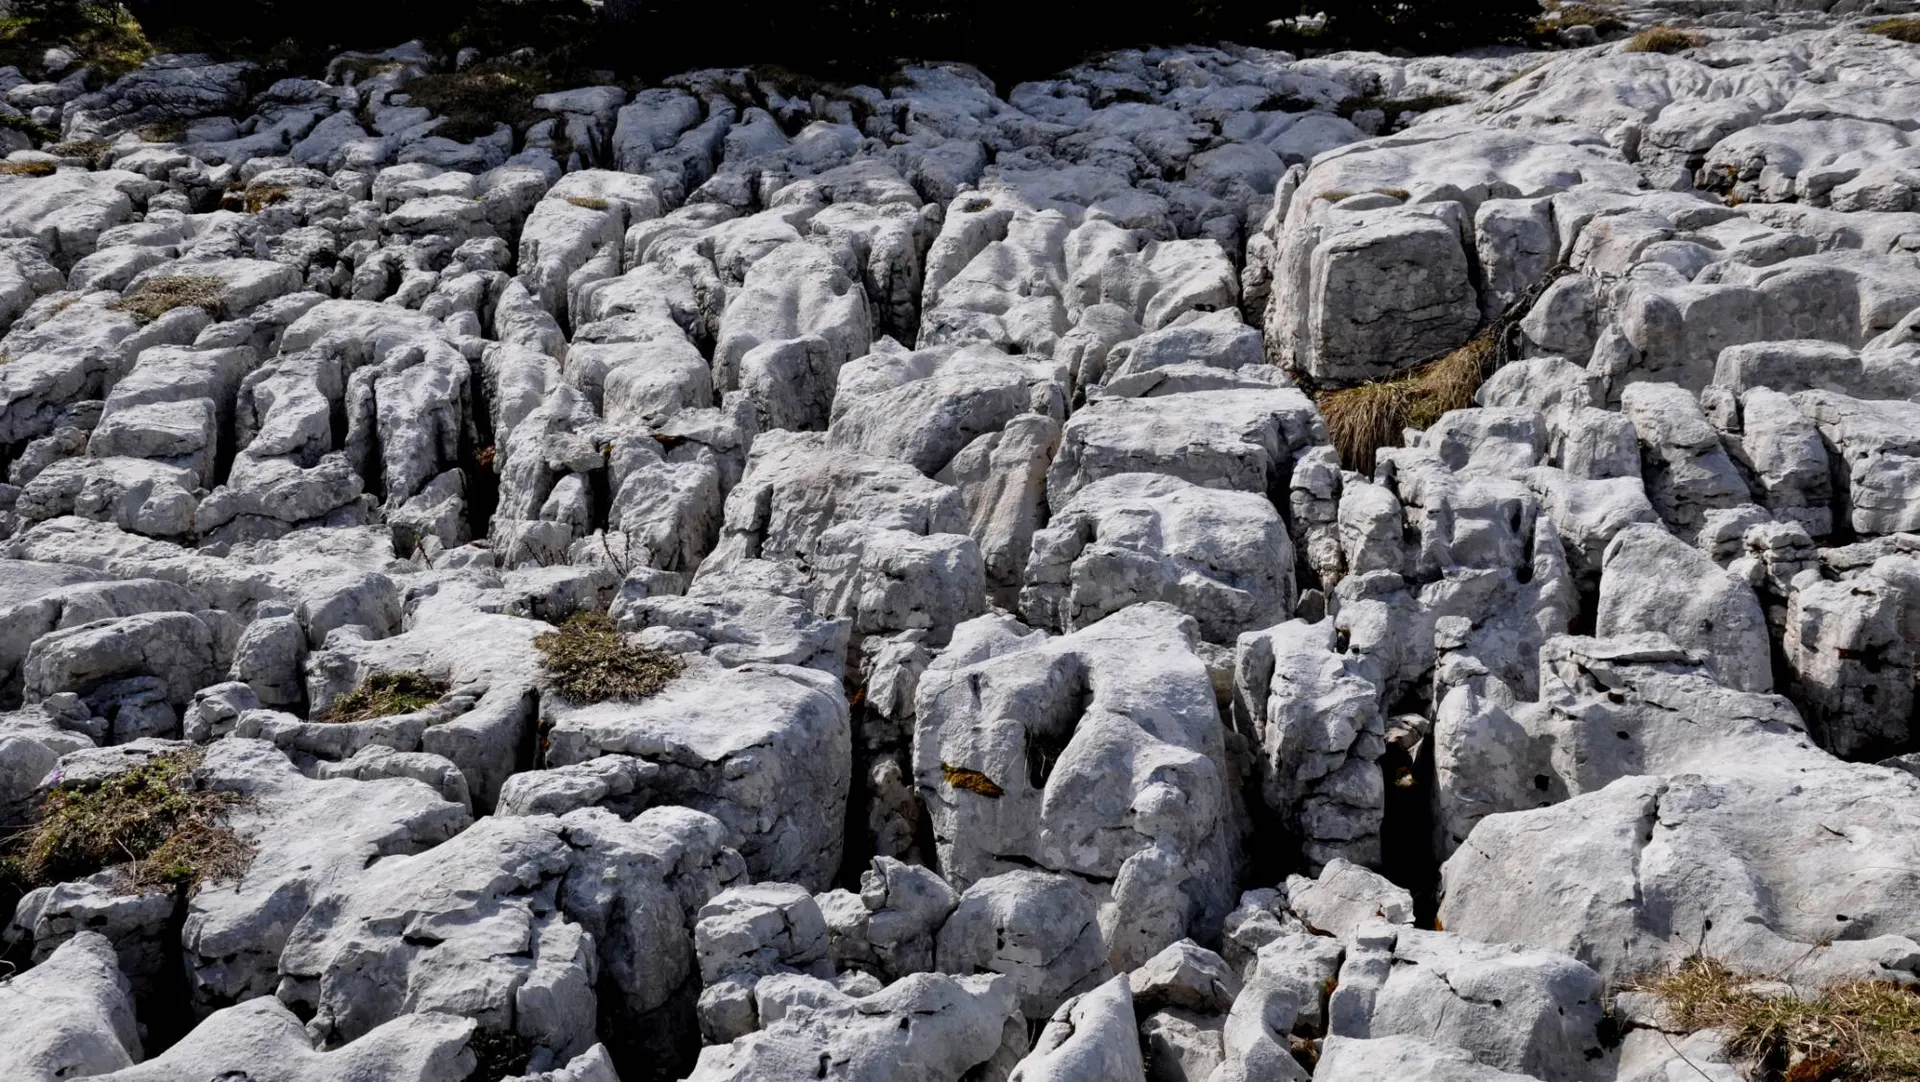
There are still places we haven’t tested Karst: dunes, volcanoes, dense city centres, ice caps, anything beyond 61° N. And yes, karst. The engine is named after the one terrain it hasn’t been tested on, so that is our next zone.
Read more
- How contours are traced: the method, step by step, with the benchmark figures and the papers it rests on.
- What the tracer does to a contour line: the full before-and-after, zone by zone.
Or just trace a zone. Every line you export, PNG, SVG, GeoJSON or DXF, now comes from Karst.