
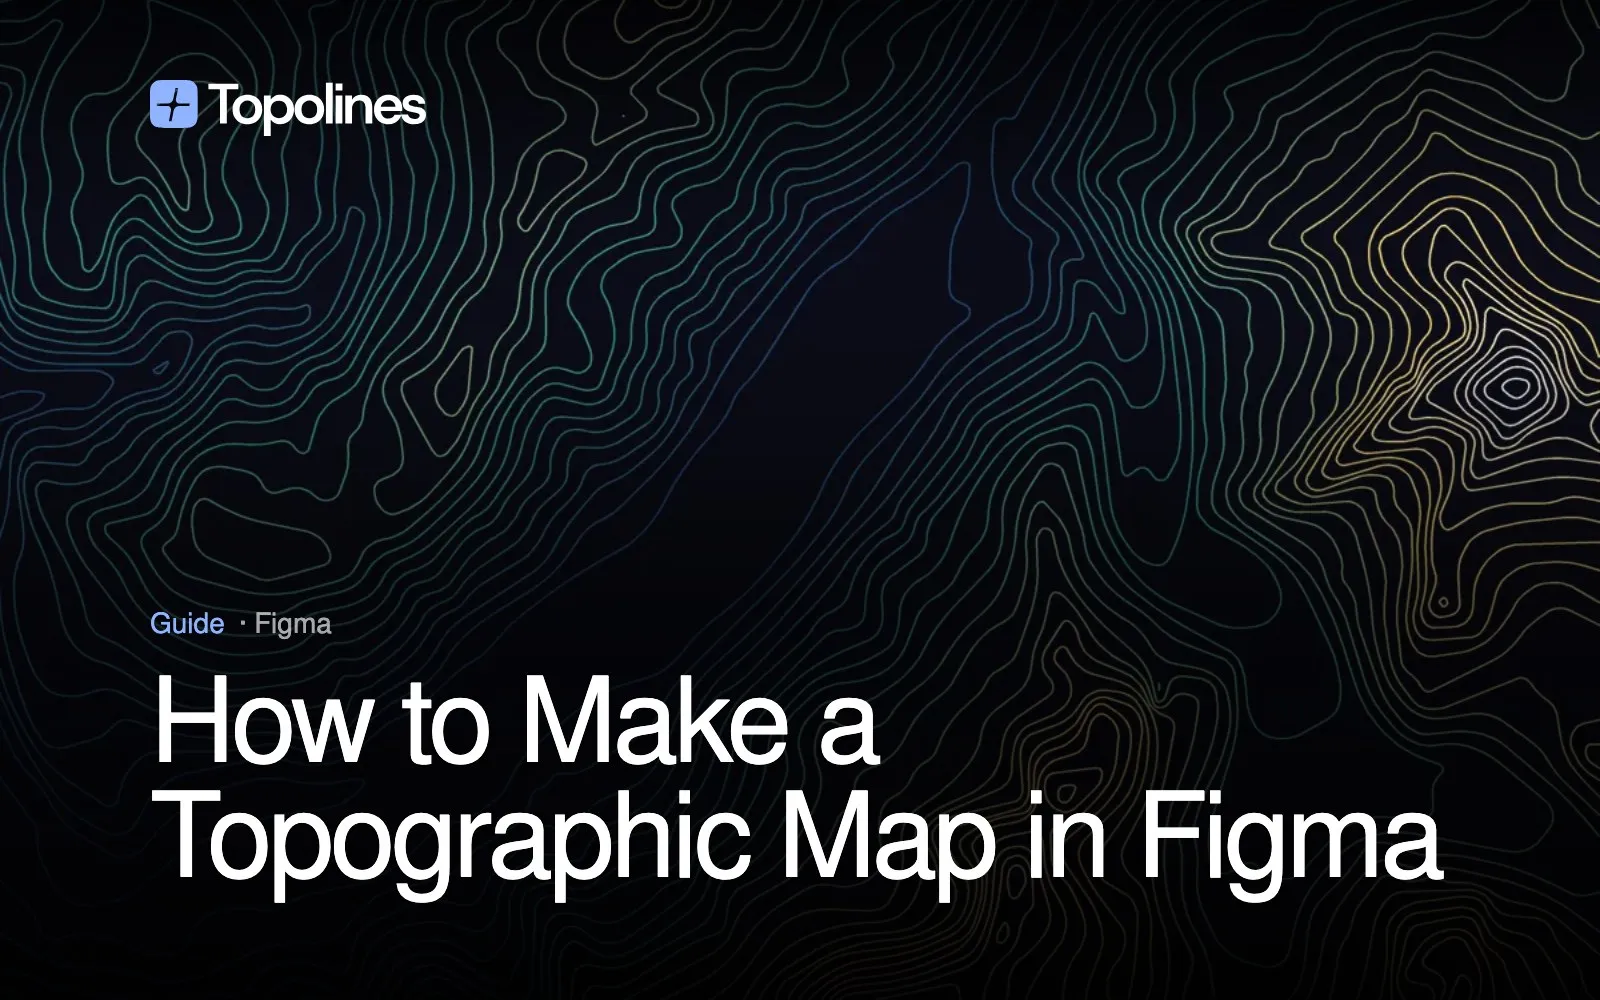
Figma is a great place to use a topographic map — in a poster, an app background, a brand system, an event invite — but it has no way to make one. There’s no elevation data inside Figma, so you can’t draw real contour lines by hand without tracing them, and tracing terrain is slow and inaccurate. The practical workflow is to generate the map from real elevation data elsewhere, then bring it into Figma as a clean, editable SVG. This guide walks through exactly that.
Generate a contour map for Figma →
Why not draw contour lines directly in Figma
Contour lines aren’t a decorative shape — each one traces a real line of constant elevation across actual terrain. Drawing them by hand means either guessing (which looks wrong to anyone who reads maps) or tracing a screenshot (tedious, and still not true to the data). Figma has no elevation layer, so there’s no shortcut inside the app.
The reliable approach is to generate the contours from real elevation data, export them as vectors, and edit the result in Figma like any other vector artwork. Because the export is real geometry, you keep all of Figma’s power — recolor, restroke, mask, animate — on top of accurate terrain.
Step 1 — Generate the map from a real place
Start by turning a location into contour lines:
- Draw a zone over the area you want — a mountain, a coastline, a whole city. The zone sets the bounding box; the contours come from the real elevation inside it, not from anything you draw.
- Set the contour interval. A tight interval gives dense, detailed lines; a wide one gives calm, minimal terrain. This is your single biggest style decision.
- Preview until the terrain reads the way you want.
The lines are generated from real elevation data (GEDTM30 30 m bare-earth, or 10 m GeoTIFF for finer detail), so what you export is an actual place — see the contour map generator for the full location-to-map workflow.
Step 2 — Export a clean SVG
For Figma you want SVG, not PNG. SVG is vector — it scales to any size with zero quality loss and stays fully editable once it’s open. A PNG locks you into its resolution and can’t be restyled line by line.
What makes the export pleasant to work with in Figma:
- Grouped by elevation band — every line at the same height shares a group, so you can recolor an entire elevation range in one click instead of selecting hundreds of paths.
- Clean paths — real curves, not thousands of fragmented segments, so the file stays light and easy to select.
- Styled at export — stroke width and color are already set, so the map opens looking finished rather than needing cleanup.
SVG export is a Pro feature; see vector SVG export for the details.
Step 3 — Bring it into Figma
Getting the SVG into Figma is just drag and drop:
- Drag the
.svgfile straight onto the canvas, or copy its contents and paste — Figma imports it as an editable vector, not a flattened image. - The map comes in as a frame of grouped paths. Because it’s grouped by elevation, you can select a whole height band and restyle it at once.
- Everything is native Figma vector from there: change stroke color and weight, drop it into a component, mask it, or set it as a background.
Tip — importing as a single block. By default the SVG comes in as many groups (one per elevation band), which is what you want if you plan to recolor by height. If you’d rather treat the whole map as one flat object, turn on the flatten option before exporting — it merges every contour into a single path so the SVG lands as one clean block in Figma instead of hundreds of groups.
Styling your topographic map in Figma
Once it’s in, a few moves cover most design use cases:
- Monochrome and minimal — one stroke color, thin weight, lots of whitespace. Reads as premium, works as an app or slide background.
- Elevation color — map stroke color to height with an elevation gradient before export, so valleys, ridges and summits read instantly once the map is in Figma.
- Hand-drawn feel — turn on tapered strokes so lines thin with elevation, giving the map the look of an inked illustration rather than a flat plot.
- Poster composition — pair the contours with type and a tight color palette; see designing with contour line art for composition ideas.
FAQ
Can I make a topographic map directly in Figma? Not from scratch — Figma has no elevation data. The workflow is to generate the contour lines from real terrain, export them as an SVG, and bring that into Figma, where they behave like any editable vector.
What format should I use to import a topographic map into Figma?
SVG. It’s vector, so it scales without quality loss and every line stays
editable. Drag the .svg onto the canvas and Figma imports it as native
vectors.
Will the contour map be editable after I import it? Yes. An SVG imports as real vector paths grouped by elevation, so you can recolor, restroke, mask or animate individual height bands directly in Figma.
How do I import the whole map as one object instead of many groups? Turn on the flatten option before exporting. It merges the contours into a single path, so the SVG lands in Figma as one block rather than hundreds of groups.
Do I need a paid plan? SVG export — the format you want for Figma — is a Pro feature. The free plan exports PNG, which drops into Figma as a flat image but can’t be edited line by line.
Turn any place on Earth into a Figma-ready topographic map. Start free →