Topographic Map of Whistler
British Columbia, Canada · 50.1172° N · 122.9543° W
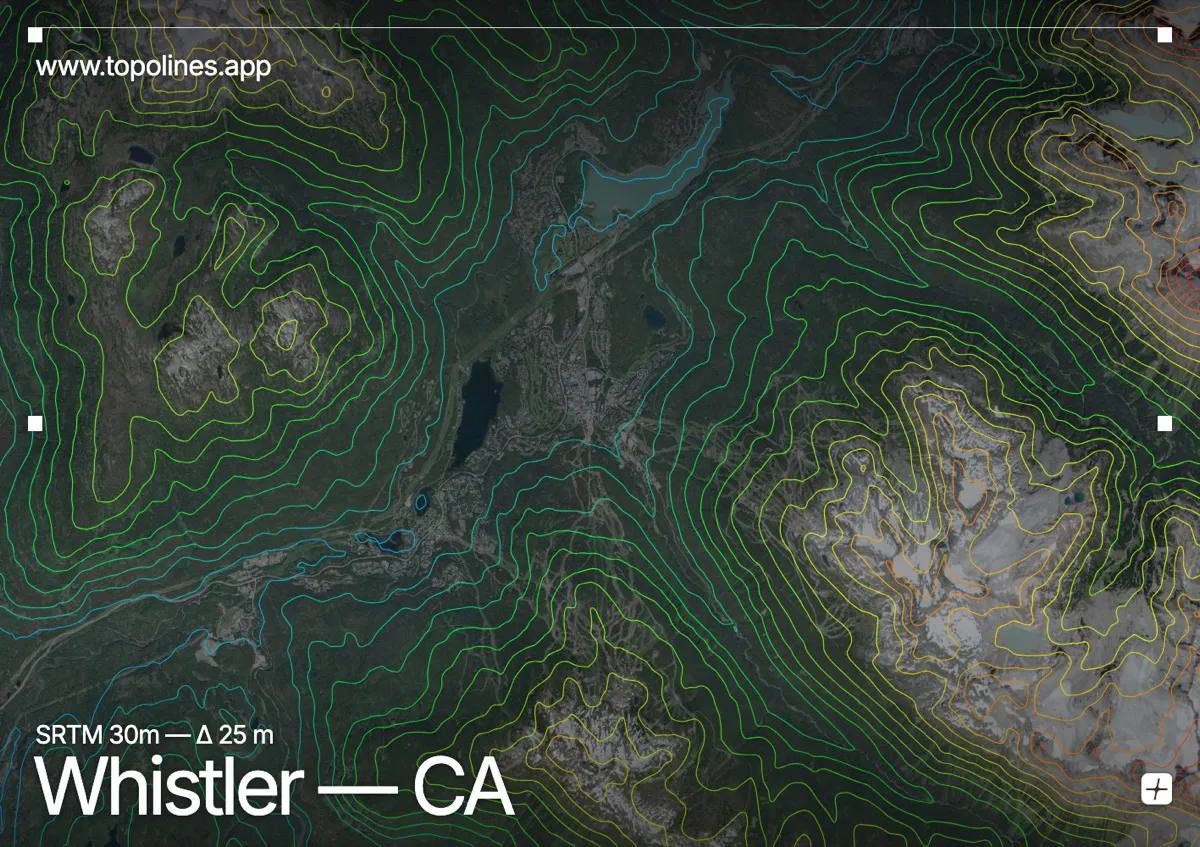
Whistler occupies a narrow valley floor at the head of the Cheakamus River, cradled by the steep, glaciated slopes of the Pacific Ranges. The surrounding topography creates a dramatic amphitheater where tightly packed contour lines climb sharply from the valley floor to broad, snow-dusted summits. This steep relief produces a striking pattern of concentric bands that clearly delineate the deep U-shaped valleys and isolated volcanic peaks.
The terrain around Whistler
The valley floor opens gradually toward the northwest, where the Cheakamus Valley widens and the contour lines spread into broad, gentle sweeps. To the south, the terrain rises abruptly into the jagged ridgelines of Whistler Mountain and Blackcomb Mountain, their steep flanks rendered as dense, closely spaced lines that trace ancient glacial cirques. Eastward, the volcanic bulk of Mount Garibaldi dominates the skyline, its rounded summit plateau contrasting with the sharper ridges that fan outward toward the Coast Mountains. These high ranges intercept Pacific moisture, carving deep U-shaped valleys and leaving narrow, steep-sided spurs that force the contour bands to compress tightly against the rock faces. Across the mapped area, the interplay of broad valley flats and sheer alpine fronts creates a highly legible topographic tapestry.
How this map was made
Every contour line traces a constant elevation drawn from the public GEDTM30 30 m bare-earth terrain model, extracted with a marching-squares algorithm at a 25 m interval and coloured by height — cool blues in the valley climbing to warm reds on the summits. The satellite base layer and the contours share the same Web Mercator projection, so the lines fall exactly on the ground they describe.
You can regenerate this exact view — and change the interval, colours, resolution or export it as a print-ready SVG — directly in the TopoLines editor.