Topographic Map of Rottach-Egern
Bavaria, Germany · 47.6910° N · 11.7707° E
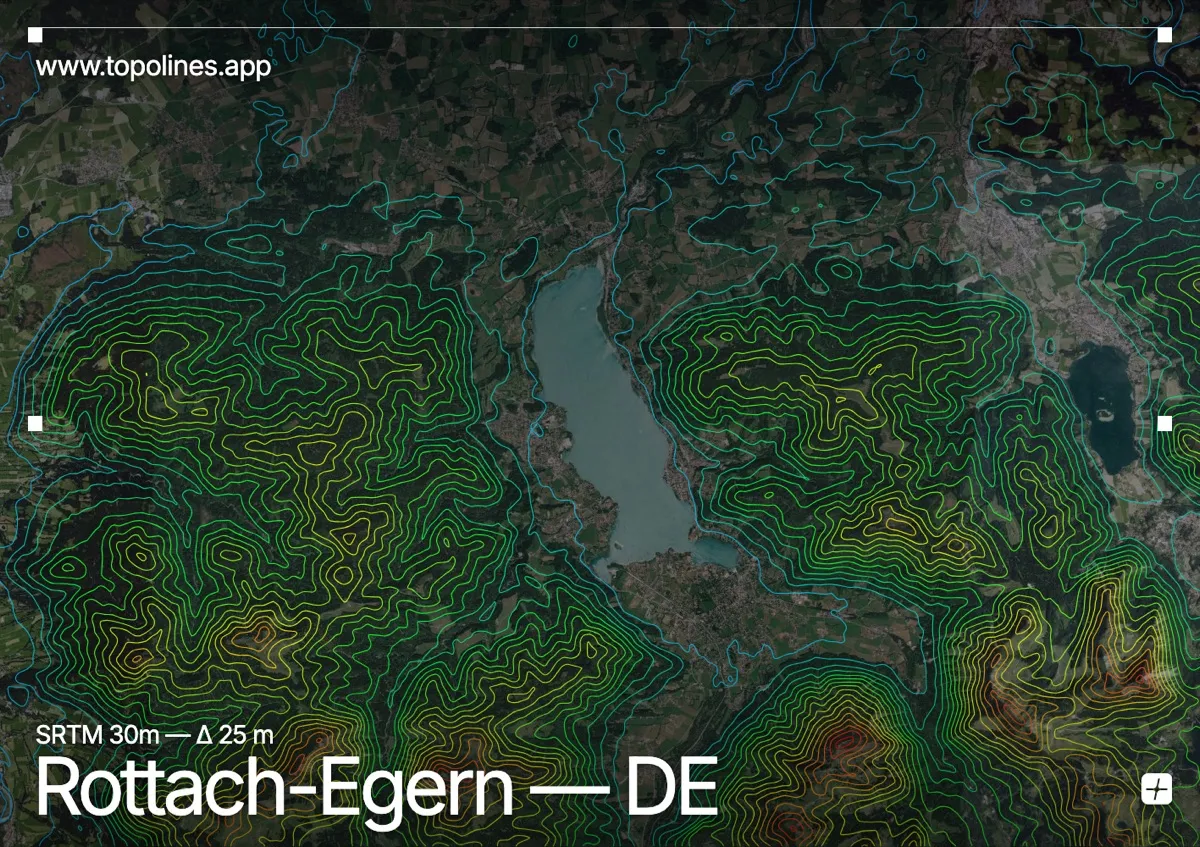
Rottach-Egern occupies a narrow strip along the northern shore of the Tegernsee, where the Bavarian Prealps rise abruptly from the water. The settlement sits at the foot of steep, forested slopes that transition into rolling highland terrain further inland. Contour lines here would capture the sharp contrast between the calm lake basin and the tightly packed ridgelines that frame the valley.
The terrain around Rottach-Egern
The Schlierberg dominates the immediate backdrop, its steep limestone and sandstone faces forcing contour lines into dense, vertical clusters. To the east and west, the Kreuzeck and Blomberg ridges extend the mountainous boundary, creating a deep U-shaped trough that funnels toward the lake. The shoreline itself flattens into a narrow ribbon of development before the water opens into the broader Tegernsee basin. Inland, the relief gradually softens as the prealpine foothills give way to undulating plateaus and scattered river valleys. Across the map frame, the contours would read as a dramatic transition from tightly wound mountain slopes to widely spaced lines over the lake and adjacent flats.
How this map was made
Every contour line traces a constant elevation drawn from the public GEDTM30 30 m bare-earth terrain model, extracted with a marching-squares algorithm at a 25 m interval and coloured by height — cool blues in the valley climbing to warm reds on the summits. The satellite base layer and the contours share the same Web Mercator projection, so the lines fall exactly on the ground they describe.
You can regenerate this exact view — and change the interval, colours, resolution or export it as a print-ready SVG — directly in the TopoLines editor.