Topographic Map of Marsberg
North Rhine-Westphalia, Germany · 51.4602° N · 8.8552° E
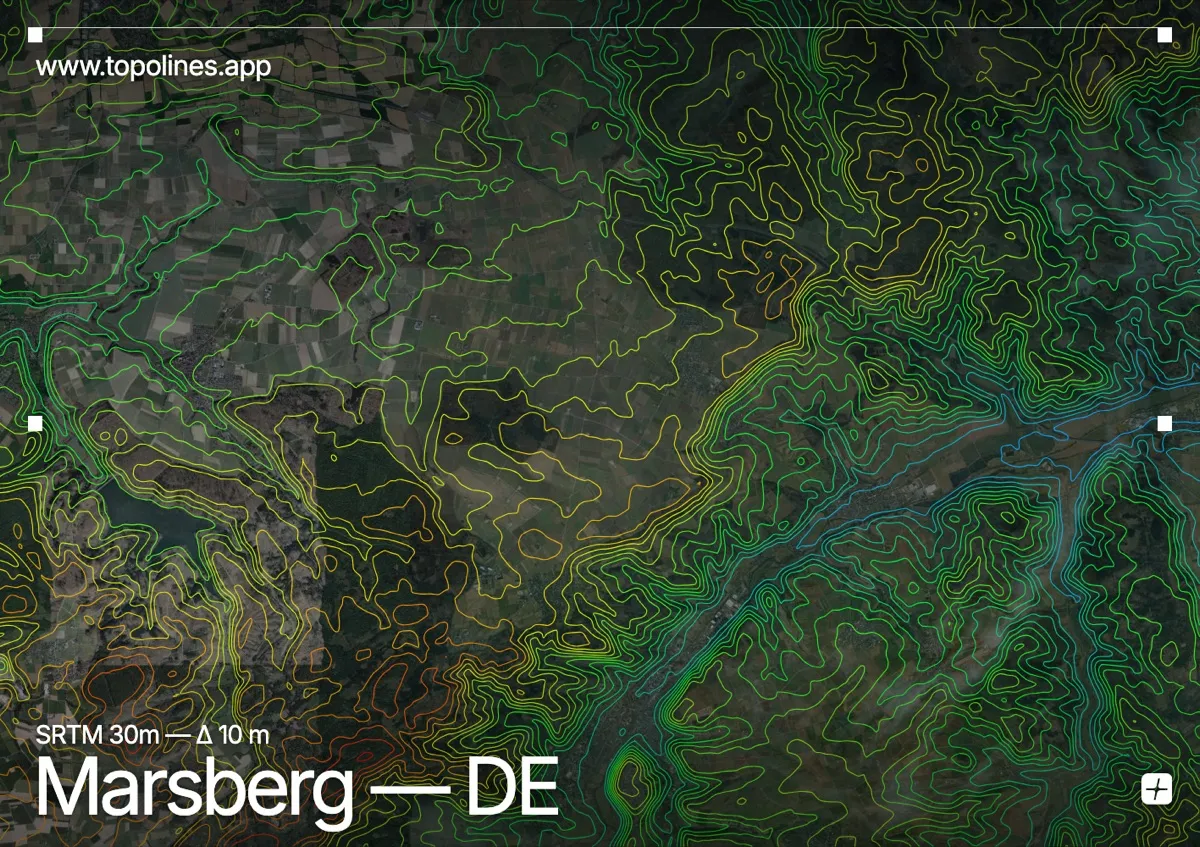
Marsberg sits at the heart of the Sauerland low mountain region, where the Diemel river carves a winding corridor through forested terrain. The surrounding landscape is defined by rolling ridges and deep incised valleys, creating a contour pattern that shifts from tightly packed lines along the steep slopes to broad, open spacing in the floodplain. This interplay of narrow valleys and elevated plateaus makes the area particularly striking for reading relief on a topographic map.
The terrain around Marsberg
The town occupies the relatively flat bottom of the Diemel valley, where contour lines spread wide and follow the gentle meanders of the river. Steeply rising on either side, the valley walls are marked by closely spaced contours that trace the forested slopes of the Sauerland hills. To the east, the terrain gradually ascends toward the more defined escarpments of the Eggegebirge, where ridgelines run parallel to the valley axis. Tributary streams cut deeper notches into the plateau, producing V-shaped depressions that break up the broader upland surface. Across the mapped area, the contrast between the narrow valley floor and the undulating high ground provides a clear, legible reading of the region’s structural geology.
How this map was made
Every contour line traces a constant elevation drawn from the public GEDTM30 30 m bare-earth terrain model, extracted with a marching-squares algorithm at a 10 m interval and coloured by height — cool blues in the valley climbing to warm reds on the summits. The satellite base layer and the contours share the same Web Mercator projection, so the lines fall exactly on the ground they describe.
You can regenerate this exact view — and change the interval, colours, resolution or export it as a print-ready SVG — directly in the TopoLines editor.