Topographic Map of Kandersteg
Bern, Switzerland · 46.4976° N · 7.6757° E
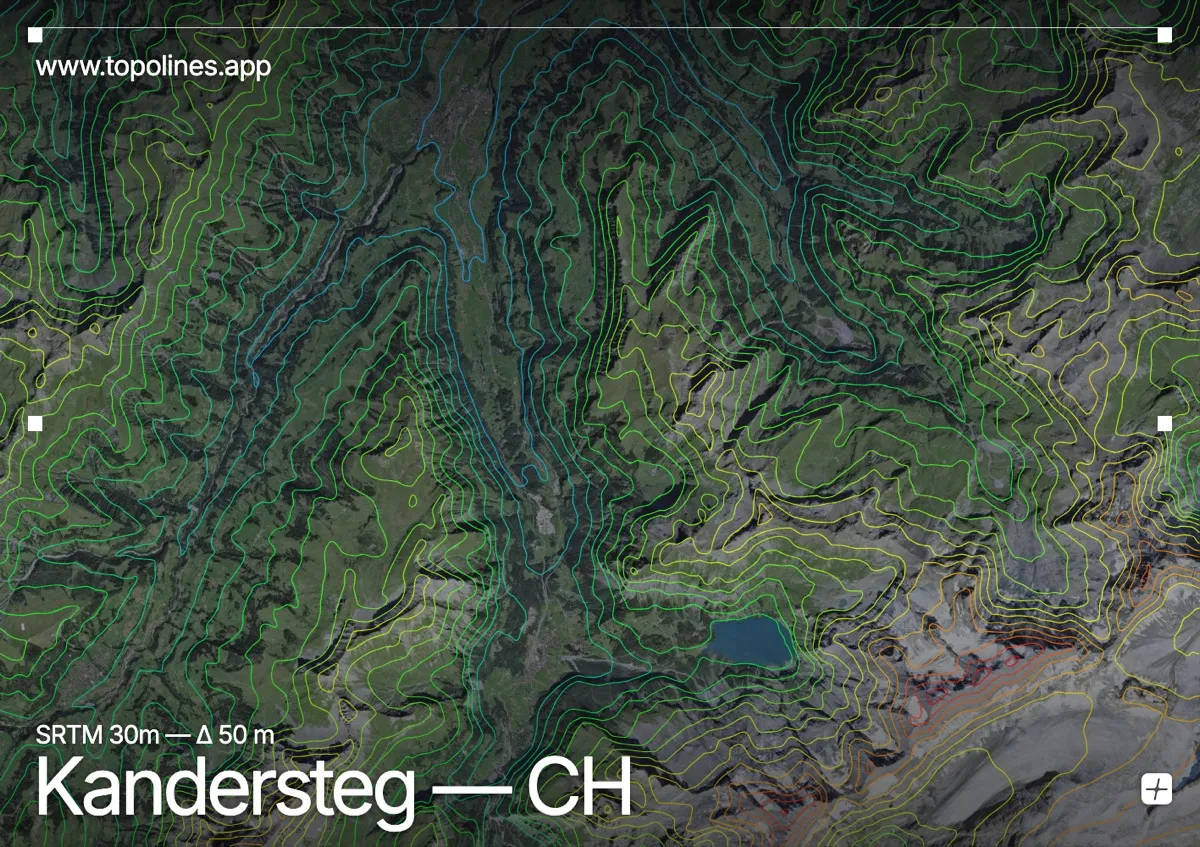
Kandersteg sits at the head of a deep U-shaped valley in the Bernese Oberland, where glacial carving has sculpted a dramatic high-alpine basin. The settlement rests on a broad floor that gradually gives way to steep cirques and hanging valleys, creating a striking contrast between open meadows and sheer rock faces. As contour lines trace the landscape, they cluster tightly along the ridgelines before spreading into broad, rhythmic loops across the river terrace.
The terrain around Kandersteg
The village is enclosed by the rugged Blüemlisalp massif to the east, whose jagged peaks and permanent snowfields force the contour lines into dense, dark bands. To the west, the forested slopes of the Schwarzenberg range descend sharply into the valley, their gradients marked by closely spaced lines that break only at small stream channels. Further south, the massive Kanderfirn dominates the horizon, its slow-moving ice carving a broad trough that funnels meltwater toward the Kander river. The river itself traces a sinuous path across the valley floor, where the contours open into wide, gentle arcs that highlight the flat glacial deposits. Steep headwalls and hanging valleys punctuate the upper slopes, ensuring that every elevation change is rendered with crisp, legible definition.
How this map was made
Every contour line traces a constant elevation drawn from the public GEDTM30 30 m bare-earth terrain model, extracted with a marching-squares algorithm at a 50 m interval and coloured by height — cool blues in the valley climbing to warm reds on the summits. The satellite base layer and the contours share the same Web Mercator projection, so the lines fall exactly on the ground they describe.
You can regenerate this exact view — and change the interval, colours, resolution or export it as a print-ready SVG — directly in the TopoLines editor.