Topographic Map of Huancayo
Junín, Peru · 12.0681° S · 75.2101° W
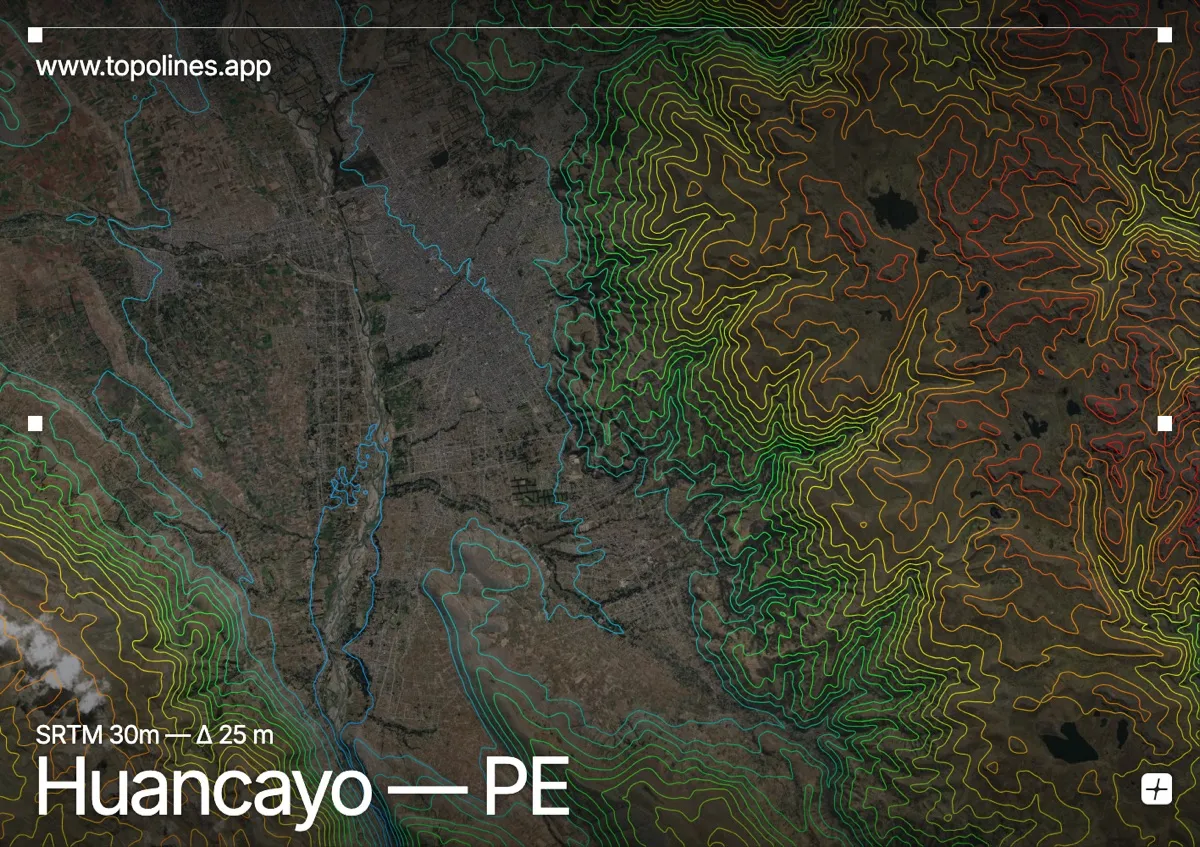
Huancayo occupies a broad intermontane basin in the central Peruvian Andes, where the Mantaro River carves a wide corridor through high plateaus. The surrounding slopes rise sharply from the valley floor, creating a striking contrast between open, gently contoured plains and tightly packed ridgelines. This topographic setting produces a clear, legible pattern of contour lines that trace the basin’s boundaries and the river’s gradual descent.
The terrain around Huancayo
The Mantaro Valley stretches out as a relatively flat expanse, allowing contour lines to spread widely before tightening against the encircling highlands. To the east, the Cordillera Rumi Cruz forms a rugged barrier of steep ridges and deep gullies, where contours compress into dense, irregular bands. Cerro San Cristóbal overlooks the urban center from the south, its slopes marked by closely spaced lines that drop abruptly toward the river. Westward, the terrain gradually ascends into rolling highland plateaus, with contour spacing widening across the gentler slopes before tightening again near the higher summits. The watercourse traces a sinuous path through the basin, its meanders creating smooth, parallel curves that contrast with the angular geometry of the surrounding peaks.
How this map was made
Every contour line traces a constant elevation drawn from the public GEDTM30 30 m bare-earth terrain model, extracted with a marching-squares algorithm at a 25 m interval and coloured by height — cool blues in the valley climbing to warm reds on the summits. The satellite base layer and the contours share the same Web Mercator projection, so the lines fall exactly on the ground they describe.
You can regenerate this exact view — and change the interval, colours, resolution or export it as a print-ready SVG — directly in the TopoLines editor.