Topographic Map of Courmayeur
Aosta Valley, Italy · 45.8317° N · 6.9462° E
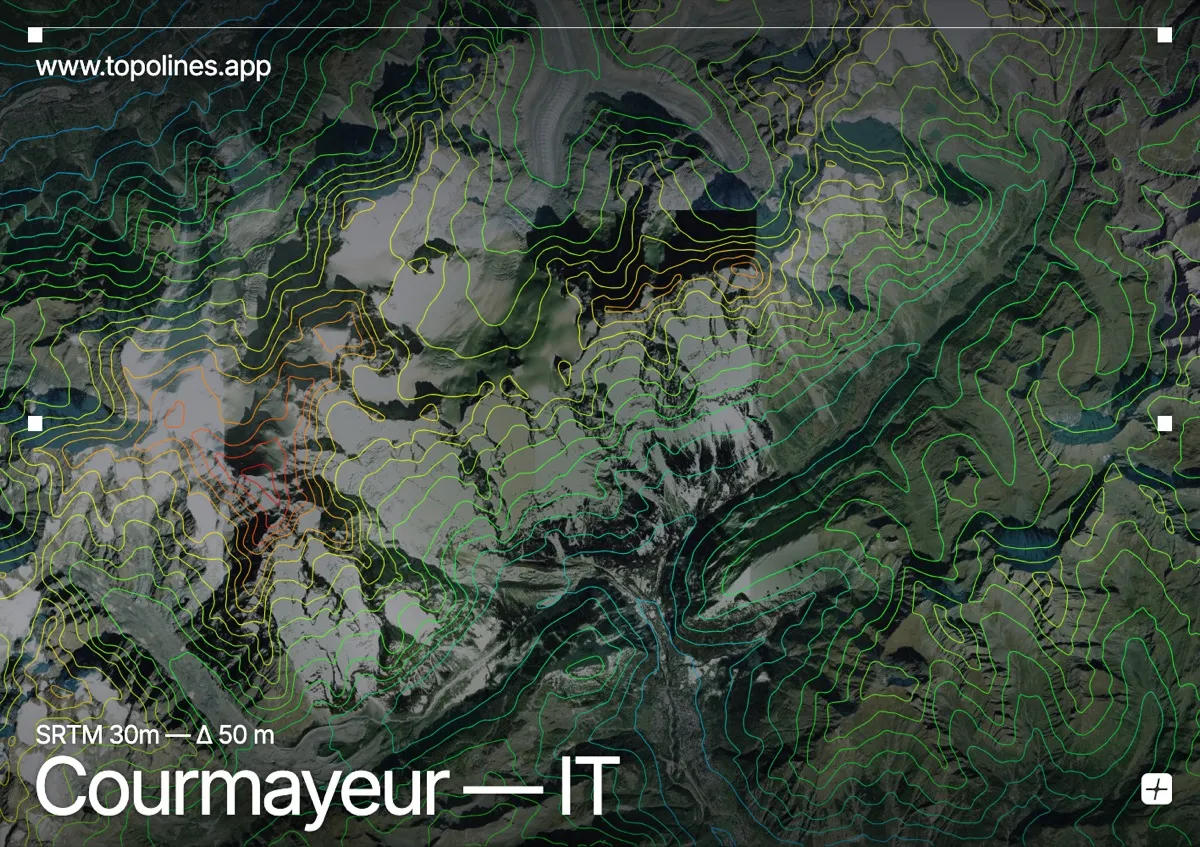
Courmayeur sits at the head of a deep alpine valley where the Italian side of the Mont Blanc massif rises abruptly from the valley floor. The town occupies a broad glacial basin that funnels steep cirques and hanging valleys toward the highest peaks of the Western Alps. Contour lines here compress sharply against sheer rock faces and glacier-carved slopes, creating a striking pattern of tightly packed curves that open into wider spacing across the valley floor.
The terrain around Courmayeur
The Mont Blanc massif dominates the northern horizon with its massive ice-covered dome and radiating ridgelines that drop directly into the town. Across the valley, the Aiguilles Rouges present a contrasting jumble of jagged granite spires and forested lower slopes that frame the approach from the south. Deep glacial troughs such as Val Veny cut eastward from the settlement, their steep walls forcing contour lines into dense, parallel bands that trace the retreat of ancient ice. River valleys branch off these main troughs, gradually widening into terraced meadows where the contour intervals spread apart. The entire landscape reads as a series of nested basins and steep amphitheaters, with the tightest packing reserved for the highest rocky summits and the broadest spacing reserved for the agricultural floors below.
How this map was made
Every contour line traces a constant elevation drawn from the public GEDTM30 30 m bare-earth terrain model, extracted with a marching-squares algorithm at a 50 m interval and coloured by height — cool blues in the valley climbing to warm reds on the summits. The satellite base layer and the contours share the same Web Mercator projection, so the lines fall exactly on the ground they describe.
You can regenerate this exact view — and change the interval, colours, resolution or export it as a print-ready SVG — directly in the TopoLines editor.